Paytm’s Big Turnaround: From Losses to a ₹552 Crore Profit In a major win for India’s fintech landscape, Paytm has officially entered its “green era.” For the first time since going public, the company has reported a full-year profit, marking a massive comeback that has caught the attention of investors and industry experts alike. For the financial year 2025-26 (FY26), Paytm posted a Profit After Tax (PAT) of ₹552 crore. To put that in perspective, this is a huge leap from previous years where the company was spending heavily to grow its user base. The Numbers at a Glance The company’s latest financial report shows growth across all its major departments: How Did Paytm Do It? It wasn’t just luck. Paytm’s “turnaround” is the result of three specific shifts in their business strategy: Why This Matters to You For the average user, this news means stability. When a tech company becomes profitable, it usually means they are here to stay. It allows them to invest more in app security, better customer service, and new features like advanced AI wealth management or better insurance products. “This is a landmark moment,” says one market analyst. “It proves that Indian startups can move away from ‘burning cash’ and actually build a sustainable, profitable business.” What’s Next? With ₹8,437 crore in revenue and a growing profit margin, Paytm’s next challenge will be maintaining this momentum while competing with rivals like PhonePe and Google Pay. For now, though, the company is celebrating a hard-earned victory. The Bottom Line: Paytm is no longer just a “growth story”—it’s now a profitable powerhouse.

Cabinet Clears New Semiconductor Projects to Boost India’s Chip Manufacturing Push
The Union Cabinet chaired by the Prime Minister Shri Narendra Modi approved two more semiconductor projects under India Semiconductor Mission (ISM) which includes country’s first commercial Mini/Micro-LED display facility based on GaN (Gallium Nitride) Technology and a semiconductor packaging facility. The two approved proposals will set up semiconductor manufacturing facilities in Gujarat with a cumulative investment of around Rs.3,936 crore and are expected to generate cumulative employment for 2,230 skilled professionals. The details of the two approved proposals are as follows: Crystal Matrix Limited (CML) will establish an integrated facility for compound semiconductor fabrication and ATMP in Dholera, Gujarat for manufacturing Mini/Micro-LED display modules. The integrated facility will also provide GaN foundry services, including epitaxy on 6” wafers. The annual proposed production capacity for Mini/Micro-LED Display Panels is 72,000 sq. meters, and for Mini-Micro-LED GaN Epitaxy Wafers is 24,000 sets of RGB wafers. The proposed products will have applications in large displays for TVs and signages/commercial displays, Medium-sized displays for tablets, smartphones, and in-car displays, and Micro-displays for Extended Reality (XR) glasses and smart watches.Suchi Semicon Private Limited (SSPL) will be setting up an Outsourced Semiconductor Assembly and Test (OSAT) facility in Surat, Gujarat for manufacturing discrete semiconductors. The proposed production capacity of the Suchi Semicon is 1033.20 million chips per annum. The target applications include power electronics, analog ICs, and industrial systems, serving end markets such as automotive, industrial automation, and consumer electronics.With these two approvals, semiconductor ecosystem in the country would get a significant boost as the total number of approved projects under India Semi-conductor Mission (ISM) reaches 12, with cumulative investments of around Rs.1.64 lakh crore.These would complement the growing world class chip design capabilities coming up in the country which are propelled by design infrastructure support provided by Government to 315 academic institutions and 104 start-ups.Momentum is building up further in the semiconductor ecosystem in India with the ten approved projects already in various stages of execution. Two projects have already started commercial shipments from India and Two more are expected to start commercial shipments soon.India has taken another significant step toward strengthening its semiconductor ecosystem, as the Union Cabinet chaired by Prime Minister Narendra Modi approved two new projects under the India Semiconductor Mission (ISM). The move is expected to boost domestic manufacturing, reduce reliance on imports, and position the country as a key player in the global electronics supply chain.The approved projects include the country’s first commercial Mini/Micro-LED display facility based on Gallium Nitride (GaN) technology, along with a semiconductor packaging unit. Both facilities will be set up in Gujarat with a combined investment of approximately Rs. 3,936 crore. Together, they are projected to generate employment for over 2,200 skilled professionals, further strengthening India’s high-tech workforce.

Storing the future: How batteries are rewriting the global energy narrative
The global energy transition is entering a new phase where battery storage is emerging as a critical pillar of modern power infrastructure. As renewable energy capacity expands rapidly across the world, the need for flexible and reliable energy storage systems has intensified. From large-scale battery installations in China and Australia to solar-plus-storage projects in the United States and emerging markets like India and Brazil, energy storage is increasingly becoming central to grid stability, energy security, and decarbonisation strategies. Falling battery costs, rising electricity demand, and growing investments in renewable energy are accelerating this transformation. At the same time, innovations in storage technologies are expanding the role batteries can play in balancing intermittent renewable power generation. As global electricity systems evolve, battery storage is no longer a complementary technology—it is becoming a foundational component of the future energy economy. The global energy landscape is undergoing a profound transformation, with battery storage emerging as a central pillar of modern power systems. Across continents, large-scale battery installations are rapidly being deployed—from solar-rich regions like Texas to Inner Mongolia’s vast grasslands and repurposed coal plant sites near Sydney. This surge reflects a convergence of economic, technological, and geopolitical forces that are accelerating the adoption of energy storage at an unprecedented pace. A recent report from InfoLink Consulting shows that global energy storage installations climbed to 275.3 GWh in 2025, registering a significant 61.3% increase compared to the previous year. The growth momentum is expected to continue in 2026, with an additional 353.4 GWh of capacity projected to be deployed worldwide, largely driven by rising electricity demand. The global shipments of energy storage cells surged to 612.39 GWh in 2025—nearly double the previous year’s level—and are forecast to climb further to 801 GWh in 2026. Shipments of battery energy storage systems (BESS) also rose sharply by 75.5% to 421.2 GWh in 2025, with expectations of reaching 600 GWh this year. How solar and wind expansion is fuelling battery adoption The rapid expansion of renewable energy—especially solar and wind—has amplified the need for storage. These energy sources are inherently variable, producing electricity intermittently depending on weather conditions. Batteries help address this challenge by storing excess power when supply is abundant and releasing it during periods of high demand or low generation. This capability enables more efficient grid management and reduces reliance on fossil fuel-based backup generation. Where coal and gas plants once filled gaps in supply, batteries are increasingly stepping in as a cleaner and more flexible alternative. Cost trends reinforce this transition. According to BloombergNEF, average costs have fallen by around 75% between 2018 and 2025 and are projected to decline by a further 25% by 2035. This rapid reduction contrasts with rising costs in other clean energy technologies, making batteries particularly attractive. As a result, developers are building projects at larger scales, creating battery fleets capable of delivering substantial amounts of power. In Inner Mongolia, for example, several large installations collectively provide gigawatt-hour-scale capacity, rivaling traditional power plants for short durations. Similarly, in Scotland, major battery facilities are being developed on former coal mining sites, symbolizing the shift from fossil fuels to cleaner energy solutions. Battery storage demand surges on renewable and economic drivers Global battery storage installations are witnessing rapid expansion, reflecting rising demand fuelled by large-scale solar and wind investments, broader electrification, and the need for stronger grid reliability. According to Wood Mackenzie, global energy storage market grew by 43% in 2025, adding 106 GW of new capacity compared to 73 GW in 2024, reflecting strong growth and investor interest. Total installed capacity has reached over 270 GW, with projections indicating a nearly sixfold rise to 1,545 GW by 2034. This trend highlights the growing importance of energy storage in the global energy transition. A key driver behind this boom is the dramatic decline in battery costs, coupled with rising global electricity demand—particularly from energy-intensive infrastructure such as data centers. Analysts had already projected strong growth in installations for 2026, expecting a significant year-on-year increase led by regions such as Europe, the Middle East, Africa, and Latin America. However, geopolitical tensions—especially conflict in the Middle East—have further intensified the shift toward batteries by increasing the cost and uncertainty of fossil fuel supplies. As a result, 2026 is shaping up to be a pivotal year in which batteries take on a more influential role in the global energy system. This momentum is already visible in market activity. Battery manufacturers, particularly in China, are reporting rising profits as global demand accelerates. In countries like Vietnam, developers are reconsidering traditional fossil fuel-based projects in favor of renewable energy systems paired with battery storage. The economics are increasingly compelling: batteries are no longer seen merely as a complementary clean technology but as a core investment option in power infrastructure. Industry sentiment reflects this shift, with storage systems now viewed as essential components of future energy networks. Global energy shift: The rising role of battery storage in key markets Australia provides a compelling case study of how battery storage is reshaping national energy systems. As the world’s largest battery market on a per capita basis, the country has demonstrated how storage can enhance grid reliability and reduce dependence on gas-fired generation. The Waratah Super Battery in New South Wales, for instance, has already shown its potential by supplying more power during peak evening demand than some gas plants. Once fully operational, it is expected to play a critical role in stabilizing the grid and addressing potential energy shortages. Falling construction costs have further improved project economics, reinforcing investor confidence in large-scale storage. China’s role in this transformation is particularly significant. The country dominates global battery manufacturing, benefiting from years of investment in its electric vehicle supply chain. This has led to an oversupply of lithium-ion batteries, driving prices down and making storage solutions more accessible worldwide. China also accounts for a substantial share of existing grid-scale installations, supported in part by past policies that encouraged renewable projects to include storage. The resulting market dynamics mirror earlier
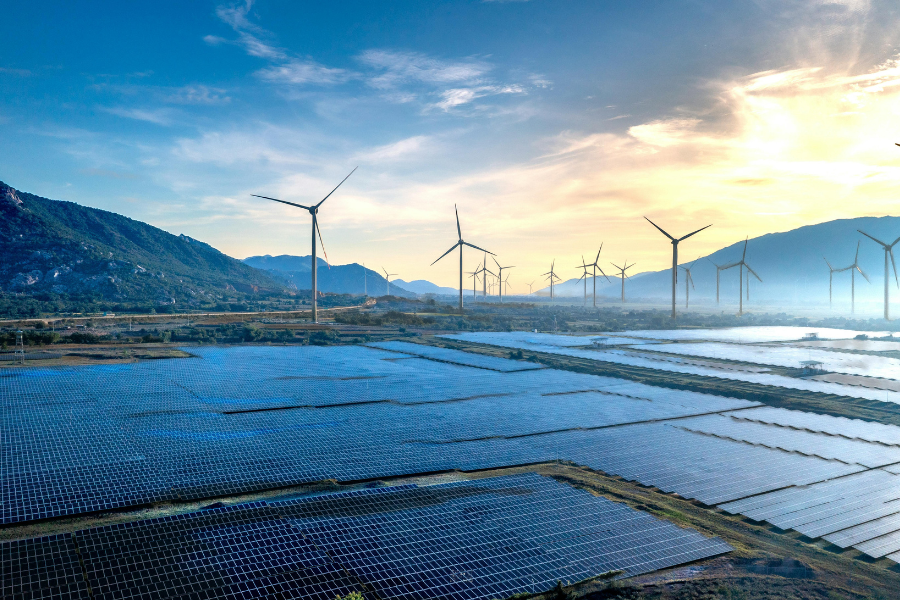
Wind power emerges as cornerstone of global energy transition.
In 2025, the global wind industry recorded a historic 165 GW of new capacity, marking a 40% year-on-year increase and taking total installed capacity to 1,299 GW across 138 countries. According to the Global Wind Report 2026, onshore wind dominated additions with 155.3 GW (+42%), while offshore installations reached 9.3 GW (+16%), pushing cumulative offshore capacity to 92.3 GW, close to the 100 GW milestone. Asia led growth with nearly 80% of new installations (around 131 GW), driven primarily by China (120.5 GW) and India (6.3 GW). Europe added 19.1 GW, surpassing 300 GW total capacity, while North America contributed 7.3 GW. The top five markets accounted for 86% of global additions. Over the 2026–2030 period, close to 969 GW of new capacity is projected to be installed, although regulatory bottlenecks and grid limitations continue to pose significant challenges to further expansion. The global wind industry achieved a historic milestone in 2025, installing a record 165 GW of new capacity—an increase of 40% over the previous year, according to the Global Wind Energy Council (GWEC). The findings, detailed in the Global Wind Report 2026, underscore the sector’s resilience and rapid expansion amid ongoing volatility in global energy markets, including supply disruptions and surging oil and gas prices. With Asia at the forefront, accelerated growth is driving fast-growing energy markets toward ‘electro-state’ economies, while demonstrating that wind power, when deployed at scale, can compete effectively with all major energy sources—from coal to nuclear. As the global energy transition accelerates, wind energy is emerging as a key driver of clean and reliable power generation. By harnessing the natural movement of air, it provides a sustainable and virtually limitless source of electricity that meets current needs without compromising the environment. In the face of rising climate concerns and the push for decarbonisation, wind power stands out for its environmental as well as economic and social benefits. In addition to delivering clean energy, it enhances energy security, generates employment, and drives technological innovation. Global capacity expansion The report highlights that by the close of 2025, global wind power capacity had climbed to 1,299 GW, with 138 countries incorporating wind energy into their electricity systems. Last year delivered record growth, with 155.3 GW of new onshore wind capacity (up 42%) and an additional 9.3 GW of offshore wind installations (up 16%). This growth highlights wind power’s increasingly central role in the global energy transition, offering a resilient, reliable, cost-effective, and domestically sourced alternative to fossil fuels at a time of heightened economic uncertainty. Around 9.2 GW of new offshore wind capacity was connected to grids globally in 2025, lifting total installed capacity to 92.3 GW and bringing the sector close to the 100 GW milestone. China led additions with 6.6 GW, while Europe brought nearly 2 GW online, including over 1 GW from the UK alone. Asia continued to dominate the global wind landscape, accounting for 131 GW of new installations—nearly 80% of the global total. This surge was led by China and India, which together added more than 126 GW of capacity during the year. China alone contributed over 120 GW, reinforcing its position as the world’s largest wind energy market. India also delivered a strong performance, nearly doubling its annual installations to a record 6.3 GW in 2025, up from 3.4 GW in 2024—an impressive 86% increase, followed by Germany (5.2 GW) and Brazil (2.3 GW). Beyond Asia, other regions also recorded significant progress. Europe surpassed the 300 GW mark in total installed wind capacity, adding 19.1 GW of new capacity in 2025—its second-highest annual addition and a 16% increase compared to the previous year. Growth in key markets such as Germany and Turkey played a crucial role in this expansion. Within the European Union, the EU-27 bloc installed 15.1 GW, reflecting a 17% rise year-on-year, however, this still falls short of the pace required to meet the bloc’s 2030 climate and energy targets. Leading regions in new wind capacity additions Region 2025 2024 2023 2022 2021 Asia-Pacific 131.8 88.3 82.9 43.2 55.1 Europe 19.1 16.6 18.2 19.5 18 North America 7.3 5.4 8.1 9.6 13.4 LatAm & Caribbean 3.7 5 6.3 5.2 5.8 Africa & Middle East 2.6 2 1 0.3 1.7 Source: Global Wind Energy Council; figures in GW Emerging regions across Africa and the Middle East also contributed notable volumes, defying expectations and demonstrating growing interest in wind energy as part of broader diversification strategies. Africa and the Middle East recorded another strong year of wind installations in 2025, led by renewed expansion in South Africa and exceptional growth in Saudi Arabia. In a notable development, the 1,500 MW Dawadmi wind farm in Saudi Arabia achieved a global benchmark by becoming the lowest-cost wind project in 2025, at just US$ 1.338/kWh. With new manufacturing facilities planned in Saudi Arabia and Oman, the Middle East is projected to add over 18 GW of onshore wind capacity between 2026 and 2030. In contrast, Latin America and the Caribbean was the only region to register a decline in annual additions during 2025. In Brazil, which installed 2.3 GW last year, new capacity additions have slowed, largely due to weaker electricity demand and rising curtailment. A significant concentration of growth was observed among the world’s leading wind markets. According to industry sources, the top five countries—China, the United States, India, Germany, and Brazil—collectively accounted for 86% of all new capacity additions in 2025. These countries together account for nearly 75% of global installed wind capacity, underscoring the critical role of supportive policies, large-scale investment, and robust infrastructure in accelerating deployment and shaping the sector’s future. Top five countries leading in new wind capacity additions in 2025 Country Annual installations (GW) Total capacity (GW) China 120.5 640.5 USA 6.9 161.2 India 6.3 54.5 Germany 5.7 77.7 Brazil 2.3 36 Source: Global Wind Energy Council The above data shows that China overwhelmingly dominates global wind capacity additions, installing 120.5 GW in a single year and accounting for the vast majority of new growth among the

Global energy trends in 2025 Signal a faster shift toward clean energy
Global energy trends in 2025 reflect a period of transition marked by slower overall demand growth and rapid expansion of clean energy technologies. According to the International Energy Agency’s Global Energy Review, energy consumption increased at a more moderate pace, even as electricity demand continued to grow strongly across sectors. Global energy demand rose by 1.3%, below the 1.4% decade average, while electricity demand increased by around 3%. Solar photovoltaic (PV) emerged as the largest contributor to global energy supply growth for the first time, accounting for over 25% of the increase. Meanwhile, renewable sources and nuclear together met nearly 60% of demand growth. The emissions in advanced economies grew by 0.5%, outpacing the 0.3% increase in emerging and developing economies. Even as the transition gathers pace, emissions trends, shifting fuel consumption patterns, and regional disparities reveal a global energy landscape that remains uneven, influenced by economic conditions, technological progress, and climate variability. Global carbon emissions saw a modest increase in 2025, rising at a slower pace as the rapid expansion of solar power helped balance out emission gains in advanced economies. According to the latest edition of the International Energy Agency’s (IEA) Global Energy Review, global energy demand expanded at a slower pace in 2025 compared to the previous year, even as electricity consumption continued to grow at a much faster rate than overall demand. A notable milestone highlighted in the report is that solar photovoltaic (PV) emerged as the largest contributor to the growth in global energy supply for the first time. The IEA report states that global energy demand growth eased to 1.3% in 2025. This figure is slightly below the average growth rate of 1.4% recorded over the past decade and significantly lower than the level seen in 2024. The slowdown in demand growth can be attributed to several key factors, including Weaker global economic expansion, Milder weather conditions in certain regions, and Accelerated adoption of more energy-efficient technologies. Together, these factors helped restrain overall energy consumption growth. Electricity demand and power sector shifts Electricity demand worldwide maintained strong momentum in 2025, increasing by about 3%, which is more than twice the pace of overall energy demand growth. Despite being slightly lower than the surge seen in 2024—largely due to reduced cooling needs in regions such as India and Southeast Asia amid less intense heatwaves—it remained above the long-term average of the past decade. The expansion was broad-based, driven by consumption across residential and commercial buildings as well as industrial activity, and further supported by rising demand from electric vehicles and the growing footprint of data centres. While all major fuels and energy technologies contributed to meeting the growing demand, their rates of expansion differed significantly. Solar PV stood out as the single largest contributor to the increase in global energy supply in 2025, accounting for more than 25% of the total growth. This marks the first instance in which a modern renewable energy source has led the expansion of global primary energy supply. Natural gas followed as the second-largest contributor, with a 17% share, reflecting its continued importance in electricity generation across many parts of the world. Taken together, renewables and nuclear power accounted for nearly 60% of the growth in energy demand. Importantly, the growth in electricity generation from these sources exceeded the total rise in electricity demand, highlighting their expanding role in the global power mix. Reflecting IEA projections, global oil demand recorded a 0.7% increase in 2025. This increase was influenced by the continued rise in electric vehicle adoption, which has begun to limit the growth in demand for traditional road fuels. Electric car sales increased by more than 20% during the year, surpassing 20 million units and accounting for roughly one in every four new cars sold worldwide. Coal demand trends showed regional variation. In China, the rapid expansion of renewable energy reduced reliance on coal in power generation. In contrast, coal demand rose in the United States, where higher natural gas prices led to a shift from gas to coal in electricity generation. Despite these differences, the overall rate of growth in global coal demand slowed in 2025. Regional trends and emissions outlook Across the global totals, energy demand trends diverged sharply among major economies. As per the report, energy demand growth in the United States rose to its second-highest level this century—excluding post-recession recovery years, driven by Strong electricity demand from data centres, Robust industrial activity, and Colder winter temperatures. China continued to be the largest contributor to global energy demand growth in absolute terms last year, though its growth rate dropped sharply to 1.7% as renewables displaced less efficient coal and energy efficiency improvements intensified. Growth in global energy-related carbon dioxide (CO₂) emissions also slowed in 2025, rising by about 0.4%. China’s emissions declined during the year, supported by the rapid deployment of renewable and other low-emissions technologies. For the first time since the 1970s—excluding the Covid-19 pandemic—India’s energy-related CO₂ emissions held steady, with an unusually strong monsoon season significantly curbing emissions growth. Notably, India’s carbon dioxide (CO₂) emissions increased by 0.5% in the latter half of 2025 and by just 0.7% over the entire year—the slowest pace of growth in more than two decades. In contrast, advanced economies experienced an increase in emissions, driven by higher fossil fuel consumption during an unusually cold winter. As a result, emissions in advanced economies grew by 0.5%, outpacing the 0.3% increase in emerging and developing economies for the first time since the 1990s. The report also highlighted notable developments in the electricity sector during the year. Solar PV generation increased by an additional 600 terawatt-hours globally in 2025, marking the largest annual increase ever recorded for any electricity generation technology. This expansion contributed to a decline in coal-fired power generation worldwide. Battery storage also emerged as the fastest-growing technology in the power sector, with approximately 110 gigawatts of new capacity added—exceeding the largest-ever annual additions for natural gas. Additionally, more than 12 gigawatts of nuclear power capacity entered construction, highlighting

India’s next smartphone shift: from scale to value?
India has emerged as the largest supplier of smartphones to the United States, accounting for nearly 40% of total imports—a dramatic shift that signals a reordering of global electronics manufacturing. According to multiple industry reports and trade data, this surge has been driven by a rapid relocation of production away from China amid geopolitical tensions, tariff pressures, and supply chain diversification strategies. Research from S&P Global Market Intelligence indicates that India’s share of U.S. smartphone imports rose to over 40% in 2025, up sharply from low double digits a year earlier. Meanwhile, estimates from Canalys suggest India’s share reached as high as 44% in certain periods, largely due to Apple accelerating iPhone production in the country. This transition reflects both policy support—such as India’s Production Linked Incentive (PLI) scheme—and a broader strategic shift by global firms. Yet, the key question remains: does this milestone reflect genuine industrial upgrading, or merely a geographic shift in assembly? India has officially become the largest supplier of smartphones to the US. The development, widely reported across business media, marks a pivotal moment in global trade dynamics. India now supplies roughly 40% of smartphones imported by the United States, overtaking China, which had long dominated the sector (TOI). This is not an incremental gain. Data from S&P Global Market Intelligence suggests India’s share of U.S. smartphone imports rose to around 42.2% in 2025, compared to 13.6% in 2024, indicating a rapid reallocation of manufacturing capacity (S&P Global Market Intelligence). Similarly, Canalys estimates indicate India’s share reached up to 44% in certain quarters, driven largely by Apple’s shift of iPhone production to India. In contrast, China’s share has declined sharply, underscoring a broader reconfiguration of global supply chains. Geopolitics, not just competitiveness At the core of this shift lies geopolitics as much as economics. US–China trade tensions, tariffs on Chinese electronics, and pandemic-era disruptions have compelled global companies to diversify their production bases. India has emerged as a preferred destination due to: Policy incentives such as the PLI scheme A growing manufacturing base Relative geopolitical alignment with Western markets According to Reuters, India became the leading production base for smartphones sold in the U.S. for the first time, with exports rising sharply as global firms scaled up local manufacturing. Apple has been the central driver of this shift, significantly expanding iPhone production in India, with a growing share of U.S.-bound devices now originating from Indian factories. The value chain question: who captures the gains? While the headline suggests a manufacturing breakthrough, the underlying economics tell a more complex story. The smartphone industry operates through a globally fragmented value chain: Brand owners (Apple, Samsung) capture the largest share through design, software ecosystems, and intellectual property Component suppliers (semiconductors, displays, sensors) account for a significant portion of value Assembly operations, where India is currently strongest, capture only a small fraction This implies that even as India’s export volumes rise, its share of total value captured remains limited. S&P Global data shows that imports of electronic components into India have increased alongside exports, indicating that domestic manufacturing remains dependent on global supply chains. An assembly-led success story India’s current position is best understood as an assembly-driven expansion. Global contract manufacturers such as Foxconn and Pegatron have enabled rapid scaling of production. However: High-value components are still largely imported Domestic firms have limited presence in core technology segments Intellectual property ownership remains concentrated abroad Even Chinese firms are now exporting “Made in India” smartphones, highlighting that the shift is geographic rather than structural. This creates the risk of an “assembly trap”—a scenario where export volumes grow, but value capture remains low. Early signs of upgrading Despite these constraints, there are early indicators of progress. India has begun pushing for component manufacturing and local value addition through policy interventions. Recent approvals for electronics manufacturing projects and incentives for domestic production suggest a strategic shift beyond assembly. There are also emerging signs of India participating upstream in the value chain, including exports of certain components to global markets. However, these developments remain at an early stage and are yet to significantly alter the structure of value capture. China’s dominance in electronics manufacturing is rooted not just in scale, but in ecosystem depth. It has built an integrated system spanning: Raw materials Components Assembly Design and innovation Even today, China accounts for a dominant share of global smartphone exports, supported by strong domestic firms and deep supply chain integration (S&P Global Market Intelligence). India, by contrast, is still in the early stages of building such an ecosystem. Conclusion India supplying around 40% of U.S. smartphone imports is a milestone that reflects both policy success and global realignment. It signals that India has become central to global electronics manufacturing. Yet, the deeper reality is more nuanced. India has captured scale—but not yet value. The next phase of India’s industrial journey will depend on whether it can move beyond assembly into components, design, and intellectual property. Ultimately, the real measure of success will not be how many smartphones India exports—but how much of their value it owns.

From LPG to plug: How electric cooking is reshaping India’s energy landscape
As geopolitical tensions in West Asia disrupt global energy confidence, Indian households are beginning to rethink one of their most fundamental consumption choices—how they cook. Concerns over potential LPG and PNG supply disruptions have triggered a rapid shift toward electric cooking appliances, from induction cooktops to air fryers. What started as a precautionary response is now evolving into a deeper structural transition, driven by favourable economics, improved electricity access, and changing lifestyle preferences. However, this shift is not without consequences. While electric cooking offers efficiency and energy security, its rapid adoption is also set to significantly alter India’s power demand profile, raising important questions around grid resilience and long-term energy planning. Amid escalating tensions in West Asia, Indian households are swiftly responding to concerns over potential disruptions in piped natural gas (PNG) and liquefied petroleum gas (LPG) supplies. This uncertainty has triggered a noticeable shift toward electric cooking solutions, particularly induction cooktops. Retailers—both offline and online—are reporting a sharp spike in demand, with sales in major cities such as Delhi, Mumbai, and Bengaluru rising multiple times over usual levels. The spike in demand highlights a combination of caution and practical foresight, with consumers seeking to protect themselves from possible fuel shortages and sudden price rises. (Notably, India spends around US$ 26.4 billion annually on cooking gas imports, much of which passes through the Strait of Hormuz, underscoring its exposure to global supply risks.) Electric cooking offers a range of advantages, including higher energy efficiency, faster cooking times, reduced dependence on imported fuels, and lower indoor air pollution. It also enables technological innovations such as precision cooking and smart cooktops. From a cost standpoint, electric cooking is already cheaper than non-subsidised LPG and PNG, and was competitive with subsidised LPG until last year. It is estimated to be 85–90% more energy-efficient and can bring water to a boil in nearly half the time. Additionally, unlike LPG and PNG, it produces no indoor emissions, making it a cleaner alternative for households. Driven by rising demand, the electric cooking appliance segment is seeing robust growth, with expansion beyond induction cooktops to include products such as electric kettles, microwave ovens, air fryers, and electric pressure cookers. Electric cooking emerges as viable alternative to LPG The shift toward electric cooking in India is gaining structural momentum rather than remaining a temporary response. Since March 2026, induction cooktop sales have surged amid tighter LPG availability, highlighting how supply-side constraints can quickly influence household energy choices. Government estimates of a 30–40% rise in demand for induction cooktops this fiscal underscore the pace at which this behavioural transition is unfolding across urban and semi-urban segments. Although India already sells around 1–1.1 crore induction units annually, recent growth is being increasingly driven by Tier-2 cities. This indicates a widening adoption base, where consumers are viewing electric cooking not just as a backup option but as a dependable and practical alternative. Evolving pricing patterns further validate this demand shift. Entry-level cooktops, typically priced at about ₹1,800, have recorded moderate increases of ₹150–200, suggesting sustained mass-market demand. Meanwhile, more significant price increases in premium models point to rising consumer willingness to spend on higher-end features, India’s cooking appliances market evolves with energy and lifestyle shifts India’s cooking appliances market is on a steady growth trajectory, having been valued at US$ 2.1 billion in 2025. According to a report by MarkNtel Advisors, the market is expected to expand to US$ 2.6 billion in 2026 and further reach US$ 3.8 billion by 2032, registering a CAGR of 7.10% over the forecast period (2026–2032). As per the report, in 2026, South India leads the India cooking appliances market with a dominant 40% share. Demand was largely driven by the residential segment, which accounted for nearly 80% of the market, highlighting strong household consumption. Among product categories, small cooking appliances captured the largest share at around 60%, indicating a clear consumer tilt toward compact and convenient kitchen solutions. The growing shift toward electric cooking is underpinned by strong economic and structural drivers. In FY 2025, consumer spending on home appliances saw a sharp increase, reflecting rising household investment in convenience and modern living. At the same time, improving electricity infrastructure across both urban and smaller cities is expanding access to electric appliances, thereby widening the consumer base and supporting sustained demand beyond metropolitan areas. Supportive ecosystem emerges for electric cooking growth Government policy is further reinforcing this momentum. The Union Budget 2026 announced customs duty exemptions on components used in microwave manufacturing to lower production costs and encourage domestic assembly. Additionally, continued support through the Production Linked Incentive (PLI) scheme for white goods is promoting local manufacturing and technological adoption. Collectively, these initiatives aim to reduce import dependence, strengthen domestic supply chains, and create a supportive ecosystem for long-term growth in the cooking appliances market. Future growth in the cooking appliances market is expected to be driven by enduring consumer preferences for convenience, energy efficiency, and multifunctional use. As households increasingly adopt smart and efficient electric cooking solutions, manufacturers and retailers are likely to broaden their product offerings to better align with evolving lifestyle demands. Additionally, supportive fiscal policies are set to play a key role by reducing constraints on domestic manufacturing and enhancing cost efficiencies. This, in turn, is expected to improve the affordability and accessibility of advanced appliances, reinforcing the market’s long-term expansion across the country. Rising peak load concerns amid cooking electrification trend Cooking with electricity is now more economical than using unsubsidised LPG. However, scaling up this transition across hundreds of millions of households presents major challenges, including affordability concerns, added pressure on the power grid, and unresolved questions about who will bear costs during peak demand periods. A rapid surge in induction cooktop adoption, driven by LPG shortages and global energy disruptions, is set to significantly reshape India’s electricity demand profile. Although usage patterns differ across India due to variations in climate, socio-economic factors, and cooking practices, the effects are expected to be most pronounced at the distribution level.

India restricts Glufosinate imports for six months
India has imposed restrictions on imports of Glufosinate and its salts under a DGFT notification dated April 13, 2026. Imports will be restricted for six months where the combined CIF value and applicable anti-dumping duty, calculated per kilogram, is below Rs 1,154. Glufosinate is an effective herbicide widely used for controlling weeds. The Government has imposed restrictions on the import of Glufosinate and its salts, a herbicide used in agriculture, for a period of six months. According to DGFT Notification No. 10/2026-27, dated April 13, 2026, imports of Glufosinate and its salts will be restricted where the combined CIF (cost, insurance, freight) value plus applicable anti-dumping duty calculated per kilogram is less than Rs 1,154. The restriction covers HS Codes 38089193, 38089199, 38089361, 38089391, 38089399, 38089912, 38089991 and 38089999 under Chapter 38 of Schedule I (Import Policy) of ITC (HS) 2022. Certain product categories will also require a certificate of registration from the government, and the policy will be reviewed after one year. India imported US$1.65 billion worth of fungicides, insecticides, herbicides and rodenticides in FY25, with about US$ 655 million sourced from China. Glufosinate-ammonium is a highly effective herbicide used to control weeds across more than 100 crops globally. Farmers rely on it because it offers strong crop safety, affecting only the plant parts where it is applied. It controls a broad range of weeds, reducing the need for multiple herbicide applications in a single crop. Its unique mode of action makes it useful in rotation with other herbicides to manage weed resistance. First introduced in 1984, it is now registered worldwide for use in crops such as soybean, corn, canola and cotton that have been genetically engineered for tolerance to glufosinate-ammonium. As a broad-spectrum herbicide, it targets both annual and perennial broadleaf weeds as well as grasses. It is also effective against glyphosate-resistant weeds such as amaranthus, lolium, conyza and malva. Its distinct biochemical pathway supports integrated weed management programs, helping improve crop health and overall agricultural yields while contributing to global food security.

From heritage to modern luxury: India’s diamond market evolves
India’s diamond jewellery market is entering a dynamic phase of growth, driven by strong economic fundamentals and evolving consumer behaviour. According to the De Beers Group’s 2025 India Diamond Acquisition Study (DAS), the natural diamond jewellery (NDJ) market is projected to reach ₹1,50,000 crore by 2030, expanding at a robust pace. Rising incomes, greater financial independence among women, and changing preferences among younger consumers are emerging as key drivers of growth. Notably, millennials and Generation Z already account for 86% of market value, reflecting a generational shift in demand. The DAS also points to growing adoption beyond metro cities and a rise in self-purchase trends, indicating that natural diamonds are increasingly seen as symbols of personal expression, not just traditional investment or bridal assets. Diamonds are among the most prized gemstones globally, valued for their exceptional brilliance, strength, and rarity. They are widely used across multiple sectors, including jewellery—such as rings, necklaces, and earrings—particularly in weddings and high-end fashion. Beyond adornment, diamonds play an important role in industrial applications like cutting, drilling, and polishing due to their unmatched hardness, as well as in technology for precision instruments and electronics. While the global diamond market is evolving with the growing presence of lab-grown alternatives, natural diamonds continue to retain strong emotional and investment appeal. Consumer preference for natural diamonds in India Natural diamonds continue to enjoy strong favour among Indian consumers, with recent trends showing that their appeal remains intact despite the increasing presence of lab-grown alternatives. This is largely due to the cultural and emotional significance attached to natural diamonds in India, where they are associated with heritage, investment, and lasting value, particularly in bridal jewellery. Industry experts note that buyers perceive natural diamonds as rare and authentic, unlike lab-grown stones, which are seen as mass-produced. Although lab-grown diamonds are more affordable, natural diamonds continue to be favoured for their- Perceived rarity, Stronger emotional and resale value, and Importance in weddings and heirloom pieces. In the Indian market, lab-grown diamonds are typically viewed as fashion accessories rather than true substitutes. Additionally, declining global prices of lab-grown diamonds have raised concerns about their long-term value, further reinforcing the appeal of natural diamonds as a more enduring asset. India’s natural diamond jewellery market enters high-growth phase India’s natural diamond jewellery market is poised for significant expansion, with its value projected to reach Rs 1,50,000 crore by 2030, according to De Beers Group’s 2025 India Diamond Acquisition Study (DAS). The report highlights that strong macroeconomic fundamentals, including an anticipated 11% annual growth in GDP and personal disposable income (PDI), are driving this upward trajectory and placing the sector firmly in a high-growth phase. This growth reflects a broader structural transformation within the domestic market. Natural diamonds are increasingly moving beyond their traditional association with bridal heirlooms and are emerging as a preferred choice for everyday wear. The shift is being fuelled by changing consumer dynamics, particularly the rising financial independence of women and evolving preferences among millennials and Generation Z. Importantly, demand is no longer confined to metropolitan centres. Tier II and III cities are becoming key growth drivers, supported by rising aspirations, improved access to luxury products, and expanding retail networks. India’s long-standing relationship with natural diamonds is thus evolving into a more contemporary and expressive form. As disposable incomes rise, consumers are placing greater emphasis on authenticity, rarity, and emotional value. This transformation not only strengthens the domestic market but also reinforces India’s position as a central force in the global diamond industry. Global market presence and consumer patterns India has emerged as the second-largest diamond jewellery market globally, accounting for 12% of global demand, up from 10% in 2019, and trailing only the United States at 53%. It has surpassed both China and Japan, each holding 5%. The country’s natural diamond jewellery (NDJ) market is currently valued at ₹785 billion, reflecting steady expansion supported by rising incomes and changing consumer behaviour. As per the report (2025 De Beers India Diamond Acquisition Study (DAS)), the share of Indian women owning natural diamond jewellery has risen to 15%, compared to 11% in 2022, while the annual acquisition rate has remained steady at 3%. The addressable market includes around 67 million women across SEC A/B segments in Tier 1–5 cities, with an average spend of approximately US$ 1,700 (₹1.4 lakh) per diamond piece. Looking ahead, the number of households earning above US$ 20,000 annually is projected to grow by 16%, doubling from 32 million in 2025 to 67 million by 2030, which is expected to significantly boost luxury consumption. The report indicates that demand for natural diamond jewellery is expected to grow at a strong CAGR of 12% between 2024 and 2030. A key driver of this growth is the increasing influence of younger consumers. Generation Z (aged 18–28) contributes 51% of total market value, driven by higher acquisition rates and the highest average spending per piece at ₹1.98 lakh, while Millennials (aged 29–44) account for 35%, together controlling 86% of the market value. Geographically, while Tier 1 and Tier 2 cities continue to generate over half of the market value, Tier 3–5 cities are gaining importance, indicating deeper market penetration. The affluent SEC A segment dominates consumption, accounting for 66% of total market value. Consumer behaviour has also evolved significantly over time. Diamonds are no longer reserved for special occasions—52% of acquired jewellery is now worn daily, compared to just 27% earlier, while occasion-only usage has dropped sharply to 10%. Additionally, outside weddings, 64% of diamond jewellery is self-purchased, often to mark personal milestones or for self-indulgence. The wedding segment remains a major contributor, accounting for 29% of total market value, with 79% driven by self-purchasing brides. However, affordability continues to be the primary barrier to purchase, cited by 24% of non-buyers, followed by a preference for gold at 19%. Lab-grown diamonds (LGDs) are gaining traction but remain a complementary segment rather than a substitute. In 2024, LGD jewellery accounted for over 20% of total diamond market value, with an acquisition

India’s EV transition gains scale, but true acceleration is yet to come
India’s electric vehicle (EV) ecosystem is entering a defining phase—one marked not just by rapid growth, but by increasing structural depth. In FY26, EV retail sales crossed 24.5 lakh units, reflecting a robust 24.6% year-on-year rise. More importantly, this growth is no longer concentrated in a single category; it is broad-based across two-wheelers, passenger vehicles, three-wheelers, and commercial vehicles. This signals a shift from early-stage adoption to a more stable, demand-led expansion, underpinned by improving consumer confidence, expanding product offerings, and policy support. However, India’s EV story is equally defined by its untapped potential. Despite strong momentum, EVs still account for a relatively small share of total vehicle sales, highlighting significant headroom for growth. As global electrification accelerates, India stands at a unique intersection—emerging as both a high-growth market and an underpenetrated one, setting the stage for its next phase of transformation. India’s electric vehicle journey is entering a new phase—one where growth is no longer episodic but increasingly systemic. In FY26, EV retail sales crossed 24.5 lakh units, marking a strong 24.6% year-on-year increase, according to the Federation of Automobile Dealers Associations (FADA). What stands out is not just the scale, but the consistency—every major segment has expanded, signalling that electric mobility is moving beyond early adoption into a more stable, demand-driven trajectory. In absolute terms, India is now adding more EVs annually than it did in the first several years of its transition combined. Yet, beneath these headline numbers lies a more nuanced shift. India’s EV adoption is accelerating at a time when the global market is also expanding rapidly, with over 18 million EVs sold worldwide in 2024. Against this backdrop, India’s share in global EV stock has steadily increased, even as its domestic penetration remains in single digits. This creates an interesting duality—India is both a fast-growing EV market and an underpenetrated one. It is precisely this combination of scale potential and structural headroom that is shaping the next phase of the country’s electric mobility transition. How the numbers add up Electric two-wheelers continued to dominate the EV landscape, crossing the 14 lakh mark during the fiscal. Sales in this segment rose 21.81% to 14,01,818 units in FY26, compared to 11,50,790 units in FY25. TVS Motor Company led the segment with 3,41,513 units, followed by Bajaj Auto with 2,89,349 units and Ather Energy with 2,39,178 units. The electric passenger vehicle (PV) segment posted the sharpest growth among high-volume categories, surging 83.63% year-on-year. Retail sales reached 199,923 units in FY ’26, narrowly missing the 2 lakh milestone, compared to 108,873 units in the previous fiscal. Tata Motors Passenger Vehicles emerged as the segment leader with sales of 78,811 units, followed by JSW MG Motor India at 53,089 units and Mahindra & Mahindra Ltd at 42,721 units. Electric three-wheelers also maintained a steady growth trajectory, registering an 18.97% increase to 830,819 units in FY26, up from 698,914 units in FY25. Meanwhile, electric commercial vehicles recorded the fastest growth, albeit on a smaller base, with sales jumping by 120.57% to 19,454 units from 8,820 units a year earlier. FADA described FY ’26 as a watershed year for India’s EV ecosystem, highlighting the sector’s growing depth and diversity—from last-mile mobility solutions such as auto-rickshaws to personal passenger cars. The consistent growth across all segments underscores the strong structural momentum driving India’s transition towards sustainable and mass-market electric mobility. India’s EV transition India has embarked on an aggressive transition towards electric mobility with multiple strategic objectives. These include reducing dependence on imported fuels, increasing the share of renewable energy by utilising the storage capacity of EV batteries, and lowering greenhouse gas (GHG) emissions. The shift also aims to improve air quality and enhance the Plant Load Factor (PLF) of electricity generation systems. Additionally, India seeks to position itself as a leading player in the rapidly expanding global electric mobility market. Although India’s electric mobility transition began at a relatively slow pace, it is now gaining steady momentum as the country works toward achieving a 30% share of EVs in total vehicle sales by 2030. Source : Vahan Portal According to the NITI Aayog report titled ‘Unlocking a $200 Billion Opportunity: Electric Vehicles in India 2025’, the electric vehicle (EV) sales in India grew from 50,000 units in 2016 to 2.1 million in 2024, bringing the country’s total EV stock to 5.45 million. This accounted for roughly 9% of the global EV stock, while India’s 2024 EV sales represented about 11% of global EV sales. Over the same period, global EV sales surged from 918,000 units in 2016 to 18.8 million in 2024, driving a rapid increase in the total global EV stock to approximately 61.21 million vehicles. India’s EV penetration, which was about one-fifth of the global level in 2020, has improved to over two-fifths by 2024. Even with steady progress, adoption continues to advance at a measured pace despite strengthening growth momentum. Key challenges in EV adoption As per the NITI Aayog report, electric vehicle adoption in India is steadily increasing, though it lags behind leading markets like the US, EU, and China. The country has seen significant growth in electric two-wheelers and three-wheelers, while progress in electric buses has been moderate. Adoption of electric cars remains slow, and long-haul electric trucks have yet to take off. The report highlights the following as the major challenges constraining progress. Financing constraints, particularly for high-cost segments such as electric buses and trucks. Insufficient charging infrastructure, along with underutilisation of available public charging stations. Limited awareness of EV performance among public and private stakeholders. Limited data availability and regulatory gaps constrain evidence-based decision-making. Policy measures and way forward Electric vehicles accounted for only about 7.6% of total vehicle sales in India in 2024, significantly below the 30% target for 2030. After nearly a decade to reach this level of penetration, the country now needs to accelerate adoption sharply, increasing the EV share by over 22% within the next five years. This necessitates stronger measures to accelerate the transition. The NITI Aayog report