India’s pulse imports fall sharply as domestic supply strengthens
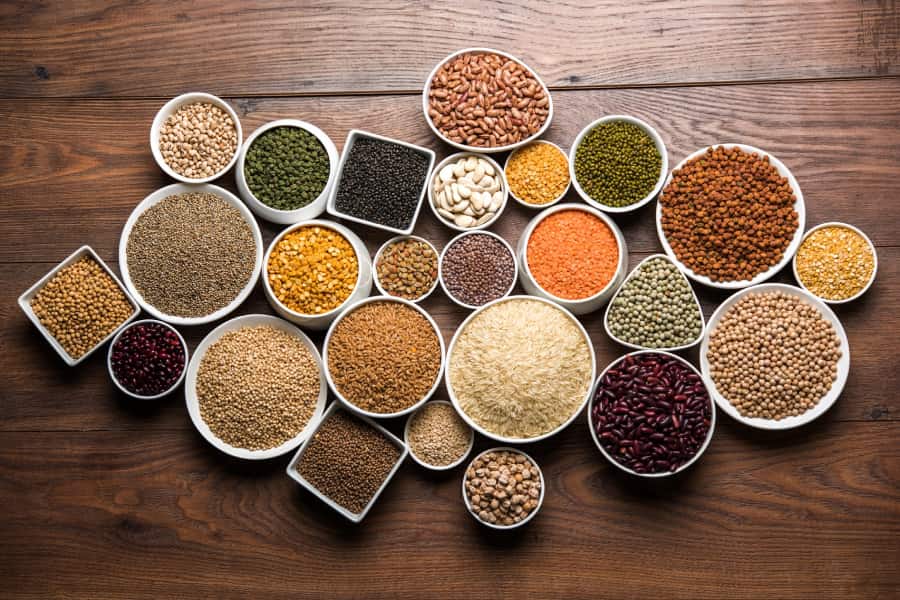
India’s pulse imports have declined sharply in FY26 after reaching record highs in the previous fiscal, driven by improved domestic production and adequate carry-forward stocks. Provisional data for April–January shows import values falling by around 35%, with volumes also contracting significantly. The correction reflects a shift in supply dynamics, as higher domestic availability reduces reliance on imports. At the same time, softer global prices have eased procurement costs, although policy measures and commodity-specific demand continue to shape import trends. The evolving pattern underscores India’s ongoing effort to balance food security with reduced import dependence. India’s pulse imports have witnessed a sharp decline in FY26 after reaching a record high in FY25, driven by adequate ‘carry-forward stocks,’ and robust domestic crop production. Provisional trade data indicate a sharp contraction in pulse imports during April–January FY26, with the value falling to US$ 2.97 billion—down 35% from US$ 4.6 billion in the corresponding period of the previous fiscal year. In volume terms, during April-January 2025–26, imports fell by over 18% to 4.9 million tonnes (MT), compared to 6.01 MT a year earlier. India imported a record 7.3 MT of pulses in FY25. As per the India Pulses and Grains Association, overall imports for FY26 are projected to remain just above 5.2 MT. In February 2026, India’s pulse imports stood at US$ 303.93 million, down significantly from US$ 494.14 million recorded in February 2025, according to trade data released by government. Global price drop and domestic gains drive import decline The decline is largely attributed to adequate carry-forward stocks and robust domestic production, which reduced the need for large-scale imports. Another key factor behind the decline is the significant drop in global pulse prices. Import costs have fallen by 30-40% due to higher global output and reduced imports. For instance, yellow pea prices have dropped to around US$ 300 per tonne from US$ 400 a year earlier, while Bengal gram prices declined to US$ 520 per tonne from US$ 700. This price correction has made imports cheaper but also reflects better domestic availability. In terms of specific commodities, during April-January, FY ’26, imports of yellow peas and masur (lentils) saw steep declines of 49% and 24% to about 1 million tonne and 0.96 million tonne, respectively, compared to the same period in FY25. In contrast, imports of urad and arhar (pigeon pea) increased by 35% and 15%, reaching 0.9 million tonnes and 1.3 million tonnes, respectively, during the first ten months of the current fiscal year compared to the same period last year. India’s pulse imports during February-March, FY ’26 were estimated at 0.2–0.3 million tonnes, sourced from countries such as Canada, Australia, and parts of Africa. As per the data, pulse production for the 2024–25 crop year is estimated at 25.68 MT, with chana accounting for the largest share at 45%, followed by moong (15%), tur (14%), and urad (8%). Pulses account for roughly a quarter of non-cereal protein intake in India and support five crore farmers and their families. The country continues to rely on imports for 18–20% of its annual pulse (tur, urad, masoor (lentils), yellow peas and Bengal gram) consumption, sourcing primarily from countries such as Canada, Russia, Myanmar, Brazil, and Africa. Pulses imported by India HS Code Commodity 2023-2024 2024-2025 % growth 07131010 Yellow peas 575.42 960.58 66.93 07131020 Green peas 4.19 1.20 -71.34 07131090 other 0.00 0.01 07132010 Kabuli chana 83.71 82.53 -1.42 07132020 bengal gram (desi chana) 111.71 1,116.64 899.59 07132090 Other chana 18.11 0.78 -95.67 07133110 Beans of the spp vigna mungo (l.) hepper 663.21 902.14 36.03 07133190 Beans of the spp vigna radiata (l.) wilczek 2.46 1.27 -48.47 07133200 Small red beans dried and shld 0.11 0.13 12.29 07133300 Kidney bens incl whte pea bens dried and shld 154.19 149.58 -2.99 07133400 Bambara beans (vigna subterranea or voandzeia subterranea) 0.00 0.18 NA 07133500 Cow peas (vigna unguiculata) 28.39 68.05 139.67 07133990 Other dried leguminus vegetables 40.89 54.88 34.20 07134000 Lentils (mosur),dried and shld 1,286.09 916.03 -28.77 07135000 Broad beans and horse beans dried and shld 8.43 3.70 -56.07 07136000 Pigeon peas (cajanus cajan) 795.08 1,285.40 61.67 07139010 Other dried and shld luguminous vegtbls,split 3.17 1.98 -37.61 07139090 Other of hdg. 071390 0.01 0.44 4059.83 Source: Department of Commerce (Values in US$ million) A year-on-year comparison of pulse imports between 2023–24 and 2024–25 highlights a divergent growth trend, with strong expansion in select commodities alongside notable declines in others. During 2024-25, imports of desi chana (Bengal gram) recorded the most dramatic increase, rising nearly ninefold (899.6%), indicating supply constraints or stock accumulation. Pigeon peas (arhar) and urad also saw robust growth of 61.7% and 36%, respectively, underscoring continued domestic shortages. Yellow peas’ import increased by 66.9%, reflecting their growing importance as an affordable alternative. Moderate gains were also observed in cow peas and other dried legumes. On the other hand, several key pulses registered decline during the period. Lentil (masur) imports fell by 28.8%, while green peas dropped sharply by 71.3%. Imports of moong-related beans, broad beans, and other chana also contracted significantly, suggesting improved domestic supply or changing consumption patterns. Kabuli chana and kidney beans remained broadly stable with marginal decreases. Although certain categories such as Bambara beans and residual “other” items show extremely high growth rates, these are largely due to a low base effect and have minimal impact on the overall trend. It is to be noted that in FY ’25, yellow peas constituted the largest share of imports at 29.5%, followed by gram (22%), tur (16.7%), lentils (16.6%), and urad (11.2%). Policy measures are shaping import trends significantly. The government is likely to extend duty-free imports of tur and urad beyond March 2026, while maintaining import duties of 30% on yellow peas and 10% on lentils for another year. These duties are subject to periodic revisions. Over the period, India’s import dependence has risen from 9% in 2020–21 to 23.1% in 2024–25, though higher imports have helped moderate pulse inflation. To address structural dependence on imports, the government has launched

Powering the transition: India’s renewable surge amid rising energy demand
As the global energy landscape undergoes a structural transformation—driven by climate commitments, geopolitical uncertainties, and the growing need for energy security—India finds itself navigating a uniquely complex path. As one of the world’s fastest-growing major economies, its energy demand continues to rise steadily, requiring a careful balance between sustainability, affordability, and reliability. Over the past decade, India has significantly accelerated its renewable energy push, supported by policy interventions, infrastructure expansion, and increasing investments. At the same time, conventional sources such as coal remain critical to meeting base-load demand. This dual reality underscores the evolving nature of India’s energy transition—where progress in clean energy must coexist with structural dependencies. Against this backdrop, the latest energy data offers valuable insights into how India is reshaping its energy mix while managing competing priorities. As the global energy landscape undergoes a profound shift—driven by climate imperatives, geopolitical disruptions, and the race for energy security—countries are being compelled to rethink how they produce, distribute, and consume power. For a rapidly growing economy like India, this transition is particularly complex: it must simultaneously meet rising energy demand, reduce dependence on imports, and accelerate the shift towards cleaner sources without compromising affordability or reliability. In this evolving context, India’s energy story is no longer just about capacity addition—it is about managing a delicate balance between growth and sustainability. The country’s policy push, investment momentum, and technological adoption are beginning to reshape its energy mix, even as traditional sources continue to play a critical role. It is against this backdrop that the Energy Statistics India 2026 report, released by the Ministry of Statistics and Programme Implementation (MoSPI), offers a comprehensive snapshot of India’s energy sector—capturing both the scale of progress and the structural challenges that lie ahead. Evolving dynamics of Indian renewable energy sector According to the report, India’s energy sector demonstrated steady expansion in FY 2024-25, with Total Primary Energy Supply (TPES) increasing by 2.95% year-on-year to reach 9,32,816 KToE (kilotonnes of oil equivalent). At the same time, India continues to hold significant renewable energy potential, estimated at 47,04,043 MW as of March 31, 2025. Solar energy dominates this potential, witnessing an exceptional surge from 7,48,990 MW in FY 2023–24 to 33,43,378 MW in FY 2024–25, accounting for nearly 71% of the total renewable energy potential. Wind power follows with 11,63,856 MW, while large hydro contributes 1,33,410 MW. Notably, over 70% of India’s renewable energy potential is concentrated in six states. These are Rajasthan (23.70%), Maharashtra (14.26%), Gujarat (9.10%), Andhra Pradesh (9.1%), Karnataka (8.59%) and Madhya Pradesh(8.09%). The country has also made significant progress in expanding its renewable energy capacity, the report stated. Installed capacity from renewable sources (including both utility and non-utility segments) has risen sharply from 90,134 MW as of March 2016 to 229,346 MW as of March 2025, registering a compound annual growth rate (CAGR) of 10.93%. Correspondingly, electricity generation from renewable sources has increased from 1,89,314 GWh in FY 2015–16 to 4,16,823 GWh in FY 2024–25, reflecting a CAGR of 9.17%. Energy consumption patterns indicate rising demand, with per capita energy consumption increasing from 15,296 megajoules per person in FY 2015–16 to 18,096 megajoules per person in FY 2024–25, growing at a CAGR of 1.89%. Improvements in efficiency are also evident, as transmission and distribution (T&D) losses declined from around 22% in FY 2015–16 to nearly 17% in FY 2024–25, indicating better utilisation of generated electricity. Despite the growth in renewables, coal continues to be the dominant energy source in India’s overall energy mix. As per the report, energy supply from coal, including lignite, increased significantly from 3,87,761 KToE in FY 2015–16 to 5,52,315 KToE in FY 2024–25. Other conventional sources such as crude oil and natural gas have also shown consistent growth over the years, reflecting sustained dependence on fossil fuels. The Total Final Consumption (TFC) of energy across end-use sectors has risen markedly, increasing by over 30.41% from 4,69,212 KToE in FY 2015–16 to 6,08,578 KToE in FY 2024–25. In parallel, financial support to the energy sector has strengthened, with credit flow rising more than sixfold—from ₹1,688 crore in 2021 to ₹10,325 crore in 2025—indicating growing investment and policy focus on the sector’s expansion and modernisation. Scaling renewable energy: Growth, policy support, and capacity building India’s renewable energy expansion reflects a policy-driven transformation that combines scale, speed, manufacturing depth, and global engagement. According to the International Renewable Energy Agency (IRENA)’s Renewable Energy Statistics 2025, India ranks fourth globally in total installed renewable energy capacity. Solar energy, notably, has witnessed a sharp and rapid surge in growth. The installed solar capacity rose sharply from rose from 3 GW in 2014 to 140 GW in January 2026. This increase has helped push non-fossil fuel capacity beyond 50% of total installed electricity capacity. Wind energy also plays a substantial role, contributing significantly to the renewable mix and strengthening grid diversification alongside solar. The installed wind capacity reached about 54.65 GW by January 2026. Solar and wind energy together make up the majority of India’s clean energy capacity. A range of government programmes has underpinned this expansion across households, agriculture, infrastructure, and manufacturing: PM Surya Ghar has driven rooftop solar adoption among 23.9 lakh households, contributing about 7 GW of distributed clean energy capacity. The Pradhan Mantri Kisan Urja Suraksha evam Utthaan Mahabhiyaan (PM-KUSUM) is promoting solarisation in agriculture, helping reduce diesel reliance and improve energy access for farmers, with a target of installing 14 lakh standalone pumps by March 2026. Around 55 solar parks across 13 states have been sanctioned, with a cumulative capacity of nearly 40 GW, accelerating utility-scale deployment. The Production Linked Incentive (PLI) Scheme, with an outlay of ₹24,000 crore, is strengthening domestic manufacturing and reducing dependence on imports. Consequently, renewable energy growth now spans generation, infrastructure, manufacturing, and global linkages. The emphasis has shifted from merely expanding capacity to creating a robust, competitive, and self-reliant clean energy ecosystem. Global engagement and India’s role in clean energy leadership While accelerating its domestic energy transition, India is also emerging as an influential

India’s dining boom: Experience, efficiency, and the rise of new markets
India’s restaurant and bar industry is at an inflection point. What was once a metro-driven, occasion-led business is now expanding into a far more dynamic, experience-oriented and geographically diverse ecosystem. From the rapid rise of Tier 2 and Tier 3 markets to the growing importance of brand storytelling, sustainability and financial discipline, the rules of hospitality are being rewritten in real time. In this evolving landscape, operators are no longer just serving food and beverages—they are building immersive experiences while navigating tighter margins, rising costs and increasingly discerning consumers. The interplay between global exposure and local identity, alongside the integration of technology and new formats, is shaping the next phase of growth for the industry. In this exclusive conversation, Angad Chachra, Founder, The Bar Consultants, shares his insights on the structural shifts driving India’s F&B sector—from changing consumer behaviour and emerging city opportunities to the economics of running a restaurant and the future of hospitality formats in the country. IBT: India’s restaurant and bar industry is expanding rapidly, especially in Tier-2 and Tier-3 cities. What structural shifts in consumer behaviour are driving this growth beyond the big metros? Angad Chachra: The growth of India’s restaurant and bar industry in Tier 2 and Tier 3 cities is being driven by a combination of rising disposable incomes, increased digital exposure and a fundamental shift from occasion-based dining to lifestyle-led consumption. With widespread access to platforms like Instagram and Pinterest, consumers in smaller cities now have expectations that are at par with metros in terms of food, design and overall experience. At the same time, lower living costs allow for greater discretionary spending on dining out. Improved connectivity, both physical and digital, along with reverse migration of professionals from larger cities, has further accelerated this trend. Consumers today are not just seeking value, but curated experiences that are social, aspirational and shareable. As a result, Tier 2 and Tier 3 cities are no longer lagging markets. They are increasingly becoming high-growth and high-potential hubs for the F&B industry. IBT: The hospitality sector often sees a high failure rate among new restaurants. In your experience, what are the most common strategic mistakes entrepreneurs make before opening their doors? Angad Chachra: One of the most common mistakes restaurant owners make before opening their doors is not planning their finances properly, especially when it comes to working capital and the initial ramp-up period. There is often an assumption that the restaurant will start attracting strong footfall from day one, but in reality, it takes a few months for marketing efforts, word of mouth and customer loyalty to build. During this time, the business continues to incur fixed costs like rent, salaries and utilities, and without a financial buffer, this early phase can quickly become stressful and unsustainable. Another major issue is underestimating the actual cost of setting up a restaurant. Many entrepreneurs begin with a fixed budget in mind, believing the project can be executed within that number, but as the build progresses, costs related to interiors, kitchen equipment, compliance and last-mile detailing tend to escalate. This often leads to either overspending or compromising on quality, both of which can hurt the long-term performance of the restaurant. At the same time, marketing and PR are frequently overlooked or treated as secondary expenses, when in fact they are critical to driving initial traction. In today’s competitive environment, even a well-designed space with great food and service can struggle if people are not aware of it. Ultimately, while most operators focus heavily on food, hospitality and interiors, the real differentiator lies in financial discipline and the ability to sustain the business through its early months until it finds stability and consistent demand. IBT: How is the Indian F&B market evolving in terms of formats — QSRs, experiential dining, microbreweries, cocktail bars, etc.? Which formats do you believe will dominate the next decade? Angad Chachra: I don’t believe there will be one single format that dominates the F&B industry over the next decade, simply because the space is evolving far too dynamically for that to happen. Consumer preferences are becoming more diverse and increasingly context-driven, which means different formats will continue to coexist and thrive in their own segments. We’re already seeing strong innovation across quick service restaurants, cocktail bars and experiential dining, each catering to very different consumer needs and occasions. QSRs will continue to grow aggressively because they serve convenience, speed and affordability – something that will always have a large market in a country like India. At the same time, as disposable incomes rise, especially in urban and emerging markets, there is a clear shift towards more premium, experience-led dining. This is where cocktail bars and experiential restaurants come into play, offering not just food and drinks, but a complete social and sensory experience. These formats resonate strongly with consumers who are willing to spend more for ambience, storytelling and differentiated offerings. Microbreweries, however, are an interesting case. While they saw a strong surge in cities like Bangalore and even places like Gurgaon at one point, the momentum seems to have slowed in recent years. This could be due to regulatory challenges, high capital costs and operational complexities. That said, the potential is still very much there. India is a large beer-consuming market with a climate that supports it for most of the year and if someone can reimagine the microbrewery format – perhaps by introducing regionally inspired flavours, seasonal brews or more accessible formats – it could absolutely see a revival and become a significant player again. Overall, the future of F&B will not be about one format winning over the others, but about how well each format adapts to changing consumer behaviour. The real opportunity lies in identifying gaps within these segments and innovating within them, rather than trying to predict a single dominant trend. IBT: We often hear that hospitality is moving from “food service” to “experience design.” What does that shift really mean for restaurant operators in practical terms? Angad

Entering Europe: From complexity to competitive advantage
As Indian exporters increasingly look beyond traditional markets, the European Union is emerging as a strategic yet often misunderstood destination. While many perceive it as complex and difficult to penetrate, the reality—as industry practitioners point out—is far more nuanced: Europe is not difficult, but deeply structured. In this conversation, we speak with Pankaj Taneja, author of a practical guide on exporting from India to Europe, who brings on-ground experience from working closely with both Indian suppliers and European buyers. Drawing from his interactions across trade fairs, market engagements, and advisory work, he offers a clear-eyed view of what it really takes to succeed in the EU—balancing compliance, localisation, cost competitiveness, and long-term relationship building. This interview explores not just the “how” of entering Europe, but also the evolving perception of Indian companies, emerging sectoral opportunities, and the strategic mindset exporters must adopt to build sustained presence in one of the world’s most sophisticated markets. IBT: Please share us some key learnings pertaining to your engagement with the EU market? How did they reshape your understanding of global trade? What insights would you like to share from your experience? Pankaj Taneja: When I first engaged with the European market, I understood it to be highly systems-driven. There was a strong emphasis on comprehensive documentation, strict regulatory compliance, structured VAT mechanisms, and a clear commitment to sustainability. However, the market is now evolving beyond these fundamentals. While compliance and sustainability remain non-negotiable, European buyers are increasingly becoming price-sensitive. At the same time, there is a growing focus on building meaningful, long-term relationships. Today, buyers are looking to partner with companies that can offer cost-effective solutions without compromising on certifications or process standards. Equally important is the ability to build trust and credibility. Once that trust is established, European buyers tend to remain loyal, often preferring to work with the same suppliers over the long term rather than frequently switching partners. IBT: We see that the EU is a market India has not penetrated as deeply as the US or the Middle East. What kind of perception do European buyers and partners have of Indian companies in terms of quality, reliability, and innovation? Pankaj Taneja: Historically, many Indian companies have been hesitant to engage with the European market, largely due to its perceived complexity. Unlike more unified markets such as the US, Europe operates as a collection of diverse economies. While there are overarching EU-level regulations, each country has its own specific requirements, processes, and often even language preferences. For instance, product labelling requirements vary significantly—what works in the Netherlands may need to be adapted into Dutch, while in Sweden, it must comply with Swedish language norms. These operational nuances have traditionally made Europe seem more fragmented and difficult to navigate. In contrast, the US market, with its relative uniformity and English-language dominance, has been far more accessible for Indian exporters. However, this perception is now beginning to shift. Recent global trade developments have encouraged Indian companies to look more seriously at Europe as a strategic market. There is a growing willingness among Indian exporters to align with European certification standards, regulatory frameworks, and process requirements. Additionally, the ongoing India–EU trade discussions are expected to further strengthen this engagement by improving market access and reducing friction points. From the European perspective, the perception of India is also evolving positively. Beyond cost competitiveness, India is increasingly seen as a reliable innovation partner. European buyers recognise India’s established strengths in pharmaceuticals, engineering, and IT services, and are now also acknowledging its growing capabilities in manufacturing. Developments in sectors such as electronics and mobile manufacturing—where global companies like Apple have significantly expanded production in India—are reinforcing this shift in perception. As a result, European companies are not only looking to source more from India but are also exploring opportunities to establish their own presence in the country. Overall, there is a clear movement on both sides—from hesitation to collaboration—driven by a combination of strategic alignment, evolving capabilities, and mutual interest in long-term partnerships. IBT: Thank you for those insights. You have authored a book—a practical guide for exporting from India to Europe, especially for founders, exporters, and business leaders. What inspired you to write this book, and what are some of the key insights you have shared? Pankaj Taneja: The idea for the book emerged from my frequent interactions with Indian suppliers during trade fairs and business visits to India. A recurring theme in these conversations was a clear gap in understanding how to enter and navigate the European market. Most exporters were already well-established in markets like the US. They would often say, “We are working with large retailers like Walmart or TJ Maxx, but we have little clarity on Europe—how to enter the market, how to manage certifications, or how to deal with regulatory requirements.” That consistent hesitation and lack of structured guidance led me to simplify the process through this book. Broadly, the book focuses on three critical pillars. First is compliance, which is fundamental to doing business in Europe. I have detailed the various regulatory requirements, testing standards, and certification processes, along with guidance on where and how exporters can access these services. Second is localisation. Europe is not a single, homogeneous market—it comprises 27 distinct countries, each with its own consumer preferences, regulatory nuances, and language requirements. A one-size-fits-all approach does not work. Whether it is labelling in local languages or adapting products to suit regional tastes—especially in sectors like food—exporters need to tailor their offerings to each market. Third is the emphasis on long-term relationships. European buyers typically do not engage in short-term, transactional business. Instead, they look for reliable partners with whom they can build sustained relationships, often spanning five to ten years. This requires consistency, trust, and a long-term commitment from suppliers. In addition to these pillars, the book also provides country-specific insights—covering market demand, product opportunities, compliance requirements, and consumer demographics—to help exporters make informed decisions. Finally, I have placed significant emphasis on sustainability, which is

India’s $8 bn play: Can sports equipment be the next export engine?
India has always been a nation that lives sport — from the wrestling akharas of ancient India to its growing dominance in global arenas. Yet when it comes to manufacturing the equipment that makes sport possible, the country punches well below its weight. With a global sports equipment market valued at US$ 140 billion today and set to nearly double by 2036, India’s 0.5% export share tells the story of a sector rich in potential but constrained by structural inertia. A new NITI Aayog report lays out a ₹7,500 crore blueprint to change that — ambitiously targeting US$ 8.1 billion in exports and 54 lakh new jobs within a decade. The window is open. The question is whether India can move fast enough to climb through it. India’s association with sport is deep-rooted and enduring, tracing back to ancient times. Long before modern stadiums and scoreboards, physical excellence was expressed through traditional wrestling akharas, the precision of archery, and indigenous games such as kabaddi and kho-kho—practices embedded in the country’s cultural and civilisational fabric since the Vedic era. In India, sport has never been merely a form of recreation; it has long symbolised strength, resilience, community, and identity. This momentum is poised to grow stronger as India enters a new phase of global sporting engagement. With ambitions to host the Commonwealth Games in the coming decade and an active bid for the Olympic Games, sport is increasingly being recognised not just as a source of national pride, but also as a strategic driver of economic growth and industrial development. Sports goods: Global market size, composition and growth trends The sports goods industry spans a diverse array of products, including apparel, footwear, equipment, accessories, and infrastructure, addressing the full spectrum of athletes’ needs. Within this ecosystem, sports equipment plays a critical role, forming the backbone of sporting activity by enabling both professional competitions and grassroots participation across schools and clubs. As per the NITI Aayog report titled “Realising the Export Potential of India’s Sports Equipment Manufacturing Sector”, the global sports goods market—covering apparel, footwear, equipment, and accessories—was valued at around US$ 700 billion in 2024 and is expected to grow at a CAGR of 4.6%, surpassing US$ 1 trillion by 2036. Within this, sports equipment segment accounts for nearly 20% of the overall US$ 700 billion sports goods market, with a current valuation of around US$ 140 billion. It is projected to grow to approximately US$ 283 billion by 2036, expanding at a CAGR of 6%. The segment is largely dominated by fitness and strength equipment, which holds a 33% share (including products such as treadmills), followed closely by ball game equipment at 32% (such as footballs). Athletic training equipment constitutes about 14% of the market, while racket and net-based sports equipment accounts for roughly 10%. Global trade landscape and India’s position Global exports of sports goods stood at approximately US$ 132 billion in 2024, with sports equipment contributing about US$ 52 billion. It is majorly led by gym and athletic equipment (27%) and bicycles (17%) as the largest export categories, followed by leg pads, nets, bats, and golf gear. China dominates this segment, holding a 40–50% share across categories, while other key exporters include the United States, Taiwan, Germany, and Vietnam. Beyond China’s dominance, the global sports goods market is relatively dispersed. The United States remains the largest consumer as well as the leading importer of sports goods, followed by key European markets such as Germany, France, and the United Kingdom. India also continues to depend on imports in this segment. Notably, although India and Vietnam had similar export shares in 2013, Vietnam has since tripled its exports, while India’s growth has stagnated. Vietnam’s success is attributed to its Ecosystem-driven manufacturing model, Strong partnerships with global brands, Effective use of free trade agreements, Cost-efficient sourcing of raw materials from China, and Coordinated policy support; (An approach India could emulate to boost its competitiveness.) Table: Top 10 sports goods exports of India HS Code Product 2020 2021 2022 2023 2024 CAGR% 950699 Articles and equipment for sport and outdoor games n.e.s; swimming and paddling pools 81.2 97.1 105.5 103.5 110.2 6.3% 871200 Bicycles and other cycles, incl. delivery tricycles, not motorised 43.7 67.9 52.7 50.4 67.3 9.0% 950691 Articles and equipment for general physical exercise, gymnastics or athletics 22.6 30.5 26.7 30.7 29.7 5.7% 950669 Balls (excl. inflatable, tennis balls, golf balls, and table-tennis balls) 16.1 20.7 26.4 24.5 24.9 9.2% 950662 Inflatable balls 12.6 19.8 20.4 21.5 21.4 11.2% 950790 Line fishing tackle n.e.s; fish landing nets, butterfly nets and similar nets; decoys and similar . . . 8.8 13.2 9.5 7.8 9.9 2.3% 950629 Water-skis, surfboards and other water-sport equipment (other than sailboards) 1.8 3.7 3.1 1.2 3.1 11.9% 950640 Articles and equipment for table-tennis 6.0 11.8 4.4 2.9 3.0 -12.6% 950659 Badminton and similar rackets, whether or not strung (other than tennis rackets and table-tennis . . . 0.4 0.6 1.2 1.3 1.1 24.2% 930400 Spring, air or gas guns and pistols, truncheons and other non-firearms (excl. swords, cutlasses, . . . 0.0 0.2 0.8 0.6 1.0 99.6% Source: ITC Trade map; (Values in US$ Million) India’s sports equipment exports show steady growth over the past five years, led by general sports equipment (6.3% CAGR) and bicycles (9.0%). Balls (9.2%) and inflatable products (11.2%) have also performed strongly, while niche segments such as badminton rackets (24.2%) and water sports equipment (11.9%) are expanding rapidly from a low base. However, table-tennis equipment has declined sharply (-12.6%), and fishing gear has grown slowly (2.3%). Overall, exports remain concentrated in a few key segments with gradual diversification. India’s sports goods export in 2024 Category India exports 2024 (US$ billion) Sports equipment 0.27 Other sports (motor boats) 0 Sports apparel 1.3 Sports footwear 0.4 Sports accessories 0.002 Other (turfs) 0.001 Total 2 As is revealed by the data above, in 2024, India’s total sports goods exports were valued at approximately US$ 2 billion. Sports apparel accounted for the largest share at US$ 1.3 billion, followed by sports footwear

From tech trend to daily utility: How Gen Z is redefining AI and AR usage
Insights from a recent ET Snapchat Gen Z report point to a significant shift in technology usage, with AI and AR becoming integral to everyday life rather than remaining emerging innovations. AI is being widely used for studying, workplace tasks, and decision-making, underscoring its role as a key productivity tool. At the same time, AR is influencing consumer behaviour, with 66% of users finding it more effective than traditional formats and 62% considering it more trustworthy, thereby shaping purchase decisions. Gen Z, in India exhibits a strong positive outlook toward AI, driven by digital familiarity and a preference for efficiency. However, this widespread adoption is accompanied by concerns over cognitive dependence, including potential impacts on critical thinking, skill development, and social interaction, reflecting a balanced and discerning approach to AI. The ET Snapchat Gen Z report, based on insights from over 1,500 respondents across multiple survey waves, highlights how artificial intelligence (AI) and augmented reality (AR) are becoming embedded in the daily routines of young users. Rather than being viewed as emerging or novelty technologies, both AI and AR are increasingly treated as practical tools that simplify everyday tasks, enhance productivity, and support decision-making. A key finding of the report by Kantar, is the evolving role of AI as a functional support system. Gen Z users are leveraging AI for studying, completing work tasks, and solving problems quickly. Instead of perceiving AI as a trend, they treat it as a reliable “tech buddy” that reduces stress and improves efficiency. This behaviour is consistent across survey periods, with sample sizes ranging from 741 to 1,534 respondents, indicating a stable and sustained pattern of usage. AI’s integration into everyday activities—such as studying, workplace tasks, and quick decision-making—highlights its evolution into a regular productivity tool rather than an experimental technology. Augmented reality is also playing a significant role, particularly in influencing consumer behaviour. The report reveals that 66% of respondents find AR tools more effective than traditional images or videos in helping them understand how products work. Additionally, 62% believe AR-based product demonstrations are more credible and trustworthy. These insights suggest that AR is becoming a crucial factor in building consumer confidence and shaping purchase decisions. Beyond shopping, AR is widely used for content creation and communication. Features such as filters, lenses, and effects enable users to create engaging and shareable content with minimal effort. This ease of use has made AR a natural part of digital expression and everyday interaction among Gen Z. The report underscores that AI and AR have moved beyond their experimental phase and are now deeply embedded in everyday usage. Rather than being treated as emerging trends, they are increasingly becoming standard features across activities such as shopping, learning, content creation, and events. The consistency in responses across multiple survey waves further indicates that this transition is structural and sustained, not temporary. Some top AI tools include: Google AI Studio, Google Antigravity. Gemini CLI, Gemini Code Assist for Individuals, NotebookLM, Translation Advanced, Cloud Vision, Speech-to-Text, Text-to-Speech, Natural Language API, Video Intelligence, Compute Engine, Cloud Storage. Top AI Platforms include CoTester, ChatGPT, Gemini, Claude, Microsoft Copilot, Perplexity, Shortwave, SaneBox, Superhuman, Reclaim, Clockwise, SkedPal, Asana, ClickUp, Tellius, Thoughtspot, Qlik Sense, Sisense. Some of the leading AR platforms include Sketchfab, Niantic, Adobe Aero, Wikitude, Unity, NVIDIA XR Suite, Apple’s Reality Kit. MetaSpark Studio, Google ARCore, Midjourney, Dall-E 3, Adobe Firefly, Google Veo, Runway, Synthesia, AI as an everyday tool: How Gen Z in India is shaping digital adoption Artificial Intelligence (AI) has become an integral part of everyday life, influencing activities ranging from virtual assistance to personalized recommendations. Its impact is particularly significant among Generation Z in India—individuals born after 2000—who have grown up in a digitally connected environment. This generation is highly receptive to AI technologies and actively engages with AI-enabled applications across various domains, including education, entertainment, and professional development. A key factor driving this adoption is Gen Z’s familiarity with technology from an early age. Their digital literacy, combined with widespread internet access and exposure to advanced tools, has cultivated a positive perception of AI. They view AI not as a complex or distant innovation, but as a practical and accessible tool that enhances their daily experiences. AI-powered platforms are seen as enablers of convenience, offering personalized content, recommendations, and streamlined services that align with their preferences. Gen Z in India also recognizes the productivity benefits associated with AI. They perceive it as a powerful tool that can, improve efficiency, support decision-making, and enhance overall performance in both academic and professional contexts. This perspective is closely tied to their desire for effectiveness and their inclination to stay updated with technological advancements. AI is viewed as an innovative solution that simplifies tasks, reduces effort, and enables smarter outcomes. Beyond functionality, this generation demonstrates a strong willingness to actively engage with AI technologies. They are eager to explore new AI-driven solutions that can make their lives easier and more seamless. This openness is driven by their adaptability, curiosity, and preference for innovation. As a result, Gen Z is not only a passive user of AI but also an active participant in its adoption and evolution. Additionally, Gen Z perceives AI as a gateway to new opportunities. They believe it can help expand knowledge, build skills, and open pathways for personal and professional growth. AI is increasingly being integrated into learning processes, career development, and creative pursuits, reinforcing its role as a catalyst for advancement. Furthermore, this generation acknowledges AI’s potential to address broader societal challenges and contribute to meaningful progress across sectors. In the workplace, Gen Z is particularly optimistic about AI’s role in enhancing productivity and job performance. They are open to incorporating AI tools into their professional lives and believe such technologies can improve efficiency, sharpen decision-making capabilities, and support career growth. Overall, Generation Z in India exhibits a distinctly positive perception of AI, accompanied by a high degree of willingness to integrate these technologies into everyday activities. This receptiveness positions them as a critical cohort

Green Hydrogen Mission gains momentum as India defines green fuel standards
India has taken another significant step in advancing the National Green Hydrogen Mission with the notification of new standards for green ammonia and green methanol. Issued by the Ministry of New and Renewable Energy, the framework establishes lifecycle emission limits and eligibility criteria for these fuels when produced using renewable-energy-based hydrogen. The standards aim to provide regulatory clarity for industry while supporting the development of low-carbon fuels across sectors such as fertilisers, shipping, power generation, and heavy industry. In a major step toward advancing the National Green Hydrogen Mission, the Government of India has notified Green Ammonia and Green Methanol Standards on February 27, 2026. Issued by the Ministry of New and Renewable Energy (MNRE), the standards establish clear emission thresholds and eligibility conditions for classifying ammonia and methanol as “green” fuels when produced using renewable-energy-based green hydrogen. The new framework defines the maximum lifecycle greenhouse gas emissions allowed during the production process. Under the Green Ammonia Standard for India, total non-biogenic greenhouse gas emissions—from green hydrogen production through ammonia synthesis, purification, compression, and on-site storage—must not exceed 0.38 kg of carbon dioxide equivalent per kg of ammonia (kg CO₂ eq/kg NH₃). These emissions are to be calculated as a 12-month rolling average, ensuring that producers maintain consistent low-carbon operations throughout the year. Similarly, the Green Methanol Standard for India sets a limit of 0.44 kg of carbon dioxide equivalent per kg of methanol (kg CO₂ eq/kg CH₃OH). This threshold accounts for emissions generated during green hydrogen production, methanol synthesis, purification, and on-site storage. Like the ammonia standard, compliance must be measured over a 12-month average period. The notification also clarifies the eligible sources of carbon dioxide that may be used in green methanol production. These include biogenic sources, Direct Air Capture (DAC), and existing industrial sources. The government has retained flexibility to revise this list in the future, with any changes to apply prospectively and accompanied by suitable grandfathering provisions to protect existing projects. Another important provision relates to the use of renewable energy. The standards specify that renewable energy can include electricity generated from renewable sources that is either stored in energy storage systems or banked with the grid in accordance with applicable regulatory provisions. This approach provides operational flexibility for developers integrating renewable energy into green hydrogen and derivative fuel production. Regulatory clarity and industrial impact The ministry has also indicated that a detailed methodology for measurement, reporting, monitoring, on-site verification, and certification of green ammonia and green methanol will be issued separately. This framework is expected to ensure transparency, traceability, and credibility in verifying that projects meet the prescribed emission thresholds. To avoid disrupting ongoing procurement processes, the notification states that tenders, bids, or solicitations issued before the standards were notified may continue under their original terms. However, procuring entities may align such tenders with the new standards if mutually agreed by all parties. The introduction of these standards offers greater regulatory clarity for industry participants, investors, and technology developers engaged in green hydrogen derivatives. By establishing clear low-carbon emission thresholds, the policy is expected to support decarbonisation efforts across sectors including fertilisers, shipping, power generation, and heavy industry. The move also reinforces India’s ambition to emerge as a major global supplier of green fuels, with domestic developers increasingly targeting export markets for green ammonia and green methanol under the framework of the National Green Hydrogen Mission. The mission, approved by the Union Cabinet of India on January 4, 2023, carries an initial financial outlay of ₹19,744 crore and aims to position India as a global hub for the production, utilisation, and export of green hydrogen and its derivatives. Green Ammonia and Methanol: Fuels powering a low-carbon future The transition toward low-carbon industrial systems is increasingly being shaped by emerging clean fuels such as green ammonia and green methanol. Among these, green ammonia—produced using renewable hydrogen generated through water electrolysis—offers a pathway to reduce emissions at the production stage while continuing to support critical industrial applications. Its growing importance lies in its ability to integrate into existing fertiliser value chains, function as a scalable energy carrier, and enable the transition of hard-to-abate sectors without disrupting ongoing industrial operations. Green ammonia provides industrial economies with a practical pathway to transition from existing infrastructure toward a low-carbon future. Instead of requiring a complete overhaul of industrial systems, it allows decarbonisation to begin within existing value chains. This is particularly significant for fertiliser production, which globally accounts for nearly 2% of total carbon emissions. Low-carbon ammonia therefore represents a crucial lever for reducing emissions across industrial and agricultural supply chains. Although ammonia’s toxicity demands robust safety and handling frameworks, fertiliser and chemical industries already possess decades of experience managing these risks at scale, providing a strong operational foundation for its expanded use. The push toward green ammonia is also being influenced by developments in the maritime sector. Demand for cleaner fuels in shipping is encouraging early experimentation with hydrogen and ammonia infrastructure. The hydrogen dispensing system established at the refinery of Indian Oil Corporation Limited in Gujarat reflects how refineries and transport networks are preparing for hydrogen- and ammonia-linked mobility solutions. Internationally, several ports in Europe and East Asia have already announced ammonia-ready bunkering infrastructure, indicating the direction in which global shipping systems are evolving. Agriculture remains another important application area for green ammonia. By enabling lower-carbon fertiliser production, it supports the shift toward more sustainable agricultural inputs while preserving existing production systems. Alongside ammonia, green methanol is gaining momentum even faster in certain sectors, particularly global shipping. Unlike ammonia, methanol can be stored and transported at normal temperatures and pressures, and it can be handled within existing marine fuel systems with relatively minor adjustments. These advantages are expected to drive strong adoption by 2030, especially as ports around the world begin building methanol bunkering infrastructure. Several global shipping companies have already ordered methanol-fuelled vessels, highlighting industry confidence in its near-term potential. Methanol also plays a significant role in the chemical industry. It can be produced by combining
Shipping disruptions threaten India’s basmati rice exports to West Asia
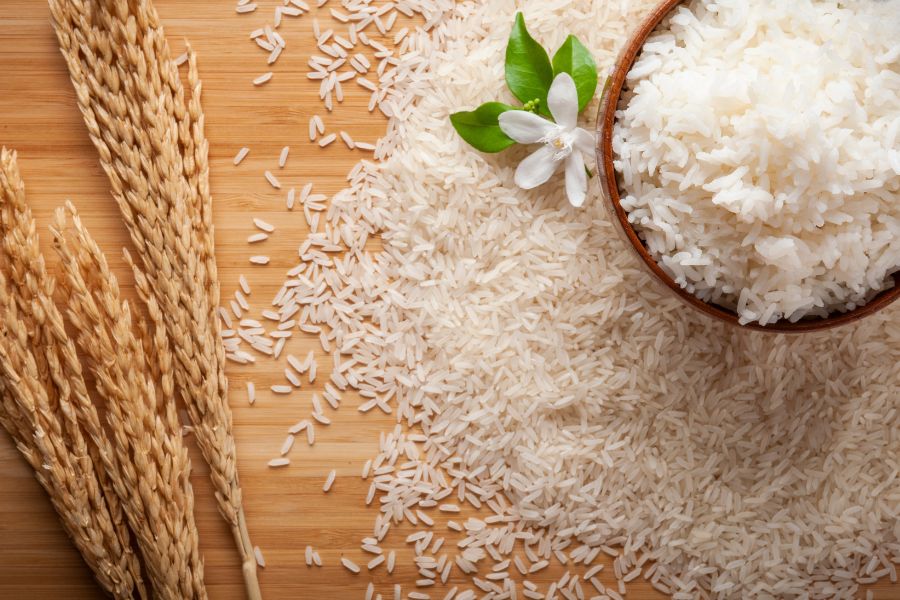
Escalating geopolitical tensions in West Asia are beginning to disrupt India’s basmati rice exports to West Asia, a trade worth nearly US$6 billion annually and heavily dependent on Gulf markets. With security concerns around the Strait of Hormuz pushing up freight and insurance costs and delaying shipments, exporters are facing mounting uncertainty while farmers in Punjab and Haryana watch domestic prices soften. The situation highlights the risks of concentrated market dependence in one of India’s most valuable agricultural export sectors. Rising geopolitical tensions in West Asia are starting to cast a shadow over global trade flows, with India’s basmati rice sector emerging as one of the industries at risk. As the standoff involving Iran, Israel and the United States intensifies, concerns are growing among Indian exporters and farmers. The worry stems from India’s heavy reliance on Middle Eastern markets, which account for a significant share of the country’s basmati shipments. Disruptions in shipping and delays in payments have created fresh uncertainty for exporters and farmers, putting exports under strain. Strong export growth but heavy dependence on West Asia Basmati rice accounts for roughly 20% of India’s total agricultural exports and command strong demand in international markets. Notably, the country exports more than 75% of the basmati production. India’s total basmati rice (HS code 10063020) exports have witnessed a steady rise over the past few years, reflecting strong global demand for the premium grain. Export earnings stood at US$ 4 billion in 2020–21, before declining slightly to US$ 3.5 billion in 2021–22. The following years saw a sharp recovery, with exports increasing to US$ 4.8 billion in 2022–23 and further rising to US$ 5.8 billion in 2023–24. The upward trend continued in 2024–25, when total basmati rice exports reached US$ 5.9 billion, the highest level during the period under review. For 2025–26 (April–December), basmati rice exports from India, have reached US$ 4.1 billion, indicating sustained demand in international markets. In 2024–25, Saudi Arabia was the biggest importer, purchasing basmati rice worth about US$ 1.20 billion. It was followed by Iraq, which imported around US$ 0.85 billion, and Iran, with imports valued at approximately US$ 0.75 billion. Other significant markets included the United Arab Emirates and the Yemen, each importing basmati rice worth about US$ 0.36 billion during the year. The US, UK, Kuwait, Oman, and Netherlands, were among other major export destinations for India’s basmati rice. In all, the Middle East accounts for nearly 72% of India’s basmati rice exports, underscoring the region’s importance to the country’s agricultural trade. Notably, Iran was once the largest buyer of Indian basmati rice. In 2018–19, it imported more than 14,83,697 metric tonnes of basmati from India. However, imports have gradually declined over the years due to economic challenges and weakening purchasing power in the country. By 2024–25, Iran’s imports had fallen to around 8,55,133 tonnes, reflecting a significant drop from earlier levels. Impact on farmers and domestic basmati prices Domestic basmati rice prices have declined by ₹400–500 per tonne following the recent air strikes in west Asia, reversing the optimism seen last month. The earlier surge had been triggered by a major export agreement with Government Trading Corporation of Iran, under which India was set to ship around 1.5 lakh metric tonnes of basmati rice to Iran. The announcement had lifted prices by ₹4–5 per kg, but the current geopolitical tensions have since pushed the market back into a downturn. A prolonged disruption in exports could push domestic basmati prices lower, putting significant pressure on farmers’ incomes. The impact would be particularly severe in Punjab and Haryana, where thousands of households depend on basmati cultivation for their livelihood. Nearly 75% of India’s premium aromatic basmati exports originate from Punjab and Haryana. According to government estimates, Punjab accounts for about 40% of the exports, while Haryana contributes roughly 35%, highlighting their dominant role in the country’s basmati rice supply. Continued uncertainty may further depress prices, intensify financial stress for exporters, and lead to losses for farmers as well as millers. Basmati trade faces headwinds as gulf shipping disruptions mount Amid fears of broader regional instability and possible disruptions to shipping through the Strait of Hormuz, the Indian Rice Exporters Federation (IREF) has advised its members to avoid entering into new cost, insurance and freight (CIF) contracts for shipments to Iran and other Gulf markets. Under CIF arrangements, exporters bear the responsibility for freight, insurance, and related costs until the cargo reaches the buyer’s port. Instead, the federation has urged exporters to prefer free-on-board (FOB) contracts wherever possible, ensuring that freight, insurance, and associated risks are handled by the overseas buyers. Shipping disruptions have left a large volume of India’s basmati rice exports in limbo, with trade bodies estimating that nearly 4,00,000 metric tonnes are affected. Approximately 2,00,000 tonnes are currently at sea, while another 2,00,000 tonnes are stuck at Indian ports, awaiting clearance or transport. Disruptions along major maritime routes, especially near the Strait of Hormuz, have severely affected cargo movement. Security concerns have slowed shipping activity, while freight rates have surged and insurers have sharply increased premiums or withheld coverage for vessels entering high-risk areas. With shipments becoming costlier and riskier, exporters have largely paused new consignments and fresh trade deals have slowed significantly. Furthermore, exporters say payments worth hundreds of crores of rupees remain outstanding. Since a significant share of basmati trade is conducted on credit, the delays have begun to strain cash flows across the industry. Exporters have approached key central agencies—including the Agricultural and Processed Food Products Export Development Authority (APEDA), the Directorate General of Foreign Trade (DGFT), and the Ministry of Commerce and Industry—seeking relief from port charges and raising concerns over what they describe as arbitrary insurance premiums imposed by shipping companies. The rating agency Crisil noted that sectors with significant exposure to West Asia — such as basmati rice exporters, fertiliser producers, diamond polishing units, airlines, and travel operators — could face short-term disruptions if geopolitical tensions persist or intensify. Industries reliant on imported liquefied natural gas (LNG),
Pump change: India’s E20 mandate Is here — and it’s more than fuel
India is set to cross a significant energy policy threshold on April 1, 2026. Every litre of petrol sold at the country’s fuel stations will contain up to 20% ethanol — a mandate years in the making that represents the culmination of one of the world’s most ambitious biofuel programmes. The move is the product of a decade-long government push to displace imported oil with domestically produced biofuel, and its ambitions run well beyond the forecourt. The E20 rollout touches farmers, distilleries, automobile manufacturers and refiners simultaneously — cutting crude import dependence, redirecting spending toward domestic agriculture, and reducing greenhouse gas emissions in one regulatory stroke. Its implications stretch well beyond what most motorists filling up at the pump will realise. From April 1, 2026, petrol sold across India will contain up to 20% ethanol and meet a minimum Research Octane Number (RON) of 95, following a fresh mandate issued by the government. In a February 17 notification, the Ministry of Petroleum and Natural Gas directed oil marketing companies to supply ethanol-blended motor spirit in accordance with Bureau of Indian Standards (BIS) specifications in all states and Union Territories. The Centre has retained the flexibility to grant limited, region-specific exemptions in special circumstances. Amid a growing debate over ethanol-blended fuel, concerns have been raised that higher ethanol content could impact vehicle performance and fuel efficiency. However, the government has firmly rejected these claims, maintaining that the blend does not lead to reduction in fuel efficiency. Ethanol push to strengthen energy security and farmer earnings The move is part of India’s broader push to accelerate ethanol blending in transport fuels. Ethanol, derived from sugarcane, maize and other grains, is a renewable and domestically produced biofuel that burns cleaner than conventional petrol. By increasing its share in the fuel mix, the government aims to curb crude oil imports, cut greenhouse gas emissions and create additional income streams for farmers through higher demand for agricultural produce and surplus stocks. Notably, the country imports around 90% of its crude oil needs and 50% of natural gas requirements. A key feature of the mandate is the requirement that E20 petrol must have a minimum RON of 95. RON, or Research Octane Number, measures a fuel’s ability to resist engine knocking — a condition where the fuel-air mixture ignites prematurely inside the engine cylinder. Persistent knocking can reduce power, lower efficiency and cause long-term engine damage. Fuel with a higher octane rating remains more stable under compression, helping preserve engine performance and prevent knocking. Ethanol, which has a naturally high octane value of around 108, enhances this stability when blended with petrol by improving the fuel’s resistance to pre-ignition. The requirement of a minimum RON 95 is therefore intended to safeguard engines and ensure smooth, efficient operation with E20 fuel. Vehicle compatibility and industry response Industry officials note that most vehicles manufactured between 2023 and 2025 are E20-compatible and are unlikely to face major issues. However, feedback from users of older vehicles suggests that E20 fuel could result in a 3–7% reduction in mileage, along with the possibility of quicker wear in some rubber and plastic parts. Despite the concerns, the transition to higher ethanol blending is expected to be smooth for the majority of vehicles on Indian roads. Industry stakeholders have welcomed the government’s decision, saying it offers long-term demand certainty for ethanol producers across the country and is expected to benefit grain-based distilleries, maize processors and sugar mills. According to the All India Distillers Association (AIDA), the mandate will spur fresh investments, drive capacity expansion and promote technological upgrades within the biofuel ecosystem. The association added that higher and more stable demand for ethanol would also strengthen farmer incomes by increasing offtake of sugarcane, maize and other feedstocks used in ethanol production. Industry experts said the ethanol blending mandate will serve multiple objectives, including optimal utilisation of the country’s expanded ethanol production capacity, while strengthening energy security and lowering dependence on fuel imports. They noted that any move to raise blending levels beyond 20% would require engineering modifications in vehicles, as most automobiles in India are currently designed to operate with petrol containing up to 20% ethanol. India reached 10% ethanol blending in June 2022, ahead of schedule, prompting the government to advance the 20% target to 2025–26 from 2030. Climate commitments and economic gains India is positioning biofuels and natural gas as key “bridge fuels” to support a gradual and practical transition toward a cleaner energy future. This approach aligns with the country’s Nationally Determined Contribution (NDC) and its commitment to achieve net zero emissions by 2070. Ethanol blending has emerged as a cornerstone of this strategy. A life-cycle assessment conducted by NITI Aayog found that greenhouse gas emissions from sugarcane-based ethanol are about 65% lower than those from petrol, while maize-based ethanol reduces emissions by nearly 50%. Apart from environmental benefits, the ethanol blending programme has generated significant economic gains, particularly for rural India. It has helped eliminate long-pending sugarcane arrears, strengthened the viability of maize cultivation and boosted farm incomes. Increased and assured payments have improved farmer welfare and contributed to addressing agrarian distress, including in regions such as Vidarbha, which had earlier witnessed widespread farmer suicides. The programme has also enhanced India’s energy security by lowering crude oil imports. From Ethanol Supply Year (ESY) 2014–15 to ESY 2024–25 (up to July 2025), ethanol blending by public sector oil marketing companies led to foreign exchange savings exceeding ₹1.44 lakh crore and crude oil substitution of around 245 lakh metric tonnes. During this period, carbon dioxide emissions were reduced by roughly 736 lakh metric tonnes — equivalent to planting about 30 crore trees. At 20% blending, farmer payments this yearare projected at around ₹40,000 crore, while foreign exchange savings may reach ₹43,000 crore. The initiative has effectively redirected funds once spent on crude imports toward domestic farmers, who are increasingly seen as both “Annadatas” and “Urjadaatas.” Concerns over vehicle performance and mileage were examined in 2020 by an Inter-Ministerial Committee of