Though a new guideline released by the General Office of the State Council, China has revised the registration and approval of pharmaceutical products to fasten the process, the implementation still needs a lot of work. China has exempted import tariffs for 28 drugs, including all cancer drugs, from 1st May 2018. The move is expected to boost Indian exports of pharmaceuticals to the neighboring country as well as help reduce trade imbalance between China and India in the future. India has time and again asked for greater market access for its goods & services including IT, pharmaceuticals & agriculture in the Chinese market to reduce the widening trade deficit. India’s trade deficit in 2017 stood at US $59.5 billion, an increase from US $ 51.6 billion in 2016. India exported US $12.5 billion worth of products to China, accounting for 4.2% of its total exports to the world. In comparison, it imported US $71.9 billion worth of products from China, making the economy the largest supplying market to India with 16.2% share in India’s total imports from the world. This move has been praised and is believed to improve India’s stand in the bilateral trade as well as bring good news for India’s pharmaceutical industry now that one of the major hurdles which is high tariffs, is gone. However, when we analyse the markets and the current situation of pharmaceutical exports, we still find few unresolved issues. Current Trade Statistics in Pharmaceutical Sector Chinese government’s decision to remove import duties on key medicines is actually an attempt to bring down its healthcare cost which is projected to almost double from US $640 billion in 2015 to US $1.1 trillion by 2020. India Is a major player in the generic pharmaceutical manufacturing and thus, India has reasons to believe that it has the ability to export low cost, high quality medicines to China. China’s total medicine imports in 2017 stood at US $25.2 billion. India is a major pharmaceutical products supplier to all the top supplying markets of medicines to China. India’s current pharmaceutical export to China stands at US $33.9 million, nothing compared to China’s huge medicine import. Among the list of products that were exported to China in 2017, pharmaceutical products were ranked 33. In terms of value, India’s pharmaceutical exports to Sri Lanka, Nepal and Myanmar was more than what is exported to China last year. Also, the move is not just India specific and is applicable to all the members of WTO. Any company from any country can avail this concession. Conclusion Though the main reason behind China’s huge trade is higher competitiveness in the manufacturing sector, the Indian exporters often complain of Chinese non-tariff barriers. Tariff barrier was hardly the major problem that so far prevented Indian companies from making their presence in China. It takes around 3-4 years to approve a drug registration, and commercialization of the drug takes a long time because of non-tariff barriers. Though a new guideline released by the General Office of the State Council, China has revised the registration and approval of drugs and medical equipment to fasten the process, the implementation still needs a lot of work. If these guidelines turn out to be useful for Indian drug manufacturers, we could see an improvement in Indian pharmaceutical exports to China in the coming years. *Source: 1) Ministry of Commerce & Industry, EXPORT IMPORT DATA BANK. 2) ITC Trade Map.


Empowering Steady Synergies – India Korea Financial Dialogue 2017
Republic of Korea acquires sixth position in the list of India’s top import source countries, with a share of 3.42% in its total imports, valuing at US$ 12.21 billion in 2016. Altogether, there is a hope of gaining a lot from India-Korea engagement at a political and economic level. The world is witnessing a new surge of protectionism, especially from the developed world. It is a period of transforming international relations for the developing ones. With a similar motive, the 5th Korea-India Financial Dialogue, a four day long meet was held on June 17, 2017, in Seoul, South Korea. Republic of Korea acquires sixth position in the list of India’s top import source countries, with a share of 3.42 per cent in its total imports, valuing USD 12214.05 million in 2016. Exports from India to South Korea are valued at USD 3465.42 million in 2016, forming 1.3 per cent of India’s exports. History of India-S. Korea partnership Openness in trade between India and South Korea was initiated with the ‘Comprehensive Economic Partnership Agreement’ which came into force on January 1, 2010, significantly impacting trade volumes between the two countries. In 2015, a special strategic partnership was shaped. Bilateral understanding in defence matters date back to 2005 when the first MoU in Defence, Industry and Logistics was signed. Agreements this year In this year’s meet, India and Korea have particularly zeroed down on cooperation in Defence, Infrastructure and Manufacturing. Defence partnership can mean maturation of India’s defence technologies. Further, the focus was primarily on infrastructure development, investment enhancement and bilateral trade. Agreement on USD 9 billion of concessional credit and USD 1 billion of Official Development Assistance (ODA), were signed between the two countries. These agreements are in line with Indian PM’s visit to South Korea in 2015, and show a continuity of efforts which binds any geopolitical strategy. A discussion of ODAs and concessional credit follows. ODAs and Concessional Credit ODAs are essentially government aid designed to promote the economic development and welfare of developing countries. Partnership with South Korea is expected to energize India’s objective of increasing spending on infrastructure. Also, such spending spans into different sectors and improves overall production and consumption capacity. Concessional Credit is a mechanism of providing credit on generous terms, below market loan requirements. Naturally, a movement of such credit from the well off to the needy economy is witnessed. India had pledged USD 10 billion concessional credit to Africa in 2010. A series of such credit between different nations establishes a nexus of inclusive global growth. Implications for India’s domestic policies The funds received under ODA will be deployed for infrastructure development projects in India, furthering India’s relocated focus on infrastructure. Similarly, the depressed state of private investment in India, which is being substituted by public spending can be eased out, though minutely, by long term stable investments coming from strategic partners like Korea. The two nations have also agreed on considering ODA fund allocation towards India’s Smart Cities Mission. It would be interesting to see how India benefits from Korea’s expertise in urban development. Altogether, there is a hope of gaining a lot from India-Korea engagement at a political and economic level. 1. Republic of Korea, South Korea and Korea have been used interchangeably 2. Data from ITC Trade Map

Soaring Current Account Deficit of India
India’s current account deficit could widen to 1.3% of GDP in 2017-18, from 0.7% in 2016-17 mainly due to stronger domestic growth in second half of the year. Import demand is expected to resume once disruptions due to the implementation of the GST settles down after July. According to the data issued by the Reserve Bank of India, the current account deficit (CAD) of the country narrowed to 0.7 per cent of GDP for the financial year 2016-17 from 1.1 per cent in 2015-16 mainly due to contraction in the trade deficit. India’s external sector balance sheet remained lower than 2 per cent of GDP during the quarter end in March of 2017, despite an increase in the merchandise import bill and almost static growth in the services income as both software services income as well as remittances by the overseas Indians were at the same level as that of the previous year. Strong FDI as well as portfolio flows resulted in a sharp rise in capital account flows, putting the overall balance of payment on a higher surplus. Trade deficit widened to US$ 29.7 billion from US$ 24.8 billion because of higher imports in the first three months of 2017. India reached a CAD of US$ 3.43 billion or 0.6 per cent of GDP in the last quarter of FY 2016-17, higher than US$ 0.3 billion gap a year earlier but lower than USD 8.0 billion in the preceding quarter. Secondary income surplus declined to US$ 24.8 billion because of higher imports. Services surplus widened to US$ 17.6 billion from US$ 16.1 billion due to higher earnings from travel, transport, construction and other business services. Primary income deficit fell to US$ 5.6 billion from US$ 6.6 billion, while private transfer receipts, mainly representing remittances by Indians employed overseas were at US$ 15.7 billion, barely unchanged from the preceding quarter. Looking at the recent data, export growth moderated sharply to 4.4 per cent in June from 8.3 per cent in May; while imports growth eased to 19 per cent in June from 33.1 per cent in May, the smallest gain since January. Some moderation on imports was expected given the slowdown in production ahead of the GST. Purchases have increased for electronic goods (24.22%); pearls, precious & semi-precious stones (86.31%); machinery electrical & non-electrical (7.02%) and gold (102.99%). Going forward, merchandise exports are expected to rise by 5-7 per cent to USD 295-300 billion and merchandise imports to expand by 6-8 per cent to USD 418-423 billion in FY 2018. Volatility in commodity prices could significantly influence the pace of growth of import and export values. With this respect, India’s current account deficit could widen to 1.3 per cent of GDP in 2017-18, from 0.7 per cent in 2016-17 mainly due to stronger domestic growth in second half of the year. Import demand is expected to resume once disruptions due to the implementation of the GST settles down after July. India needs to implement more policies in order to improve manufacturing sector and production to increase its export of goods and services to a greater extent. The country needs to focus on decreasing the imports of the major contributors, especially gold. Despite many steps taken to reduce it in recent years, there has been significant jump in gold demand. Savings being wasted on a dormant metal instead of being invested in productive business activities is a major concern. Any significant strides on this front would require structural reforms of the financial sector that encourages more competition to spur financial innovation and access.

Trilateral to Multilateral: A scope of expanding ASEAN trade
There are three trade related impediments to an upsurge in India- ASEAN trade ties- inadequate infrastructure, no regional transit trade and consequently, high trade costs (especially transport costs). Investing vigorously in market expansion, through infrastructure is crucial. Changing geopolitical dimensions in world economy and the attention centered on India’s growth are strong reasons for India to extend its strengths within and around its frontiers. One of the sources to bestow the required strength is ‘Trade’, and a pre- requisite to efficient trade is logistics and facilitation. It is with this intent that India has rerouted its energies towards the India-Myanmar-Thailand Trilateral (IMTT) Highway, and other infrastructure projects in the eastern region. The IMTT Highway, started in 2005, starts from Moreh in Manipur on the India – Myanmar border and connects Tamu (Myanmar) ending at Mae Sot in Thailand. The total length of the Highway is approximately 1360 km. As of now, the deadline to complete the project stands at 2019-20. The motive of the trilateral collision spans around three Cs- commerce, connectivity and culture. Reduction in travel time, development of regional market emerging on both sides of the border, support to services trade is the most basic expectation out of this development. Improvements on these grounds can be a stimulus for growth in northeastern region of India too. Among the commodities that will benefit from this reduced travel time and cost, perishable ones are expected to be top gainers. A look at Myanmar’s top five perishable commodities’ imports from the world and India’s share reveals several anomalies. Despite less distance geographically, trade distances are immense. For HS code 170199, India captures major proportion of Myanmar’s imports; but for the remaining products, India’s share is meagre. Consider ‘Food preparations n.e.s (HS code 210690). India exported US$ 191 billion worth of this product to the world in 2016, and consistently enjoys a big export market due to indigenous taste and making. Myanmar has huge demand for this product but apparently not from India. The overall picture that emerges is that of immense potential of trade which this southeastern block can unlock for India. Table 1: Top perishable commodities’ imported by Myanmar in 2016 HS Code Name Top exporting nations to Myanmar India’s share in Myanmar’s imports 170199 Cane or beet sugar and chemically pure sucrose, in solid form India, Thailand, Brazil, El Salvador, Morocco 52% 151620 Vegetable fats and oils and their fractions, partly or wholly hydrogenated, inter-esterified Thailand, Malaysia Close to 0% 210690 Food preparations, n.e.s. Thailand, Singapore, China, Malaysia, Taipie Chinese 0.30% 190190 Malt extract; food preparations of flour, groats, meal, starch or malt extract Singapore, Thailand, Malaysia, Germany, India 0.70% 230990 Preparations of a kind used in animal feeding Thailand, Italy, China, Argentina, Canada 1.30% Source- ITC Trade Map Database, 2016 A similar analysis can be done for Thailand, which possesses huge trade potential for India given its geographical proximity to India. The prospects of further extensions are positive since in response to a query in December 20161, the Minister of State of Ministry of External Affairs mentioned that the Government of India is exploring the possibility of extending the IMT highway to Cambodia, Lao PDR and Vietnam. India’s initiatives in the eastern region offer much more than visible at first look. To bring the broader picture in perspective, it is essential to look at what impact these developments entail for India’s partnership with ASEAN. Mainly, there are three trade related impediments to an upsurge in India- ASEAN trade ties- inadequate infrastructure, no regional transit trade and consequently, high trade costs (especially transport costs). In spite of FTAs in goods, services and investment between India and ASEAN, there hasn’t been any significant upsurge in trade volume or value between the two. India’s share in total ASEAN total trade was a meagre 2.6 per cent2 in 2015, and ASEAN’s imports from India were even lower- only 1.8% (USD 19,453 million in absolute value) of its total imports. Investing vigorously in market expansion, through infrastructure hence appears to be a crucial development. And with India’s growth counterpart going for active consolidation, India must act fast. 1. Rajya Sabha Starred Question No. 2578, India- Myanmar- Thailand Highway 2. ASEAN External Trade Statistics 2015, Table 19

Box Shifting and the need for Special Safeguard Measures
India understands this abuse of green box and its implications and therefore the need to reform and amend policies related to these boxes in order to stop box shifting. It also believes that there must be clear special safeguard measures. India will be pushing for finalising the work programme for a transparent Special Safeguard Measures (SSM) in the WTO Summit to be held in Argentina this December. SSM allows developing countries to raise import duties on agricultural products in response to import surges. The 10th Ministerial Conference at Nairobi only recognised the rights of developing nations to have recourse to the SSM but no convergence was achieved with respect to details of the mechanisms. Also, a historic decision to eliminate export subsidies was taken. As per the rule, developed nations were required to eliminate all subsidies immediately. However, developing countries like India is required to eliminate agriculture export subsidies including transport and marketing subsidies by 2023. Till then, it should try to make optimal use of this time period by extending support to sectors like food processing industry. This industry has huge unrealized potential and its growth is partially contingent on government’s support. Export subsidies to this industry, in its initial years, can build a strong foundation for India’s agricultural exports in future SSM is a key policy instrument for securing the survival of small farmers and rural poor, and ensure food security in a country like India. Developed countries like the US, EU, Canada etc give massive amount of farm subsidies to their farmers. These subsidies have trade distorting effects and also hit the poor farmers in the developing and least developed countries (LDCs). According to WTO’s Agreement on Agriculture (AOA), green box includes farm support measures that are minimally or non- trade distorting and are exempt from any limits. Developed countries have smartly redesigned their strategies relating to farm support as a result of which, today, the bulk of support given to the farmers in the developed world is in green box. Though it is claimed by these nations that they have reduced the export subsidies and other domestic support given to their farmers but the fact is that these countries have maintained exactly the same distribution of farm subsidy payments. They have only decoupled it from current production levels. Total Support Estimate (TSE), which measures the overall burden of the support to agriculture as a percentage of GDP has remained more or less constant in developed countries. The figures for US, EU and Japan in 2015 were 0.42, 0.7 and 0.97 respectively. Despite the fact that TSE has remained constant, in absolute terms, the support has increased over the years on account of increase in GDP. Countries like US, EU and Japan have substantially increased their green box expenditures under different categories of decoupled income support, domestic food aid and general services provided by government. Studies have shown that green box subsidies do encourage agricultural production and lower the risk involved. The sheer scale of payments made under green box has power to harm farmers in the developing countries and LDCs and force them to face unfair competition from the highly subsidised agricultural products from the developed world. This also makes them more vulnerable in times of price volatility. India understands this abuse of green box and its implications and therefore the need to reform and amend policies related to these boxes in order to stop box shifting. It also believes that there must be a degree of differential treatment for developing countries. This is why India will be pushing for SSM and is so adamant about its transparent implementation.

Integrating neighbouring economies to expand regional trade
India needs to acknowledge the fact that its future in international trade lies in the sub-continent. There is huge trade potential between India and its neighboring countries. If India provides sub-continental and Indian Ocean linkages, it can be in the connectivity business. Source: https://bit.ly/36jsu0O The easiest market access for most finished goods is in nearby countries; but history, political rivalry, colonial rules and a host of other reasons might have left this natural advantage unexploited. This needs to be nurtured with transport infrastructure and appropriate policies. Small and medium enterprises are more at ease if the market is closer from their own productive locations. A much wider business community can take profits from trade if cross-border trade is high on the agenda of trade decision-makers. Literature on international trade too corroborate this fact which is acknowledged as “Natural Trading Hypotheses” India’s Present Situation The current government expressed its desire to improve neighborhood ties by introducing “Connectivity” as its foreign policy theme in 2016. Integrating the South Asian economies through enhanced connectivity is logical, but complex primarily because of India’s poor ties with Pakistan. A remarkable aspect of the present PM’s foreign visits are his visits to key neighbors, the first in -17 years to Nepal, 28 years to Sri Lanka, 34 years to UAE and the first ever to Mongolia. His “neighborhood first” agenda was visible since he first took over the office. In the recent times India has had conflicts with Nepal, Sri Lanka and Maldives, but the biggest failure relates to its ties with Pakistan and China. In the past decade, China has emerged as the top exporter of goods to the neighboring regions, including to India, breaking into South Asian markets with its export-led growth strategy. China overtook India as Bangladesh’s top trading partner. It displaced many Indian goods in Bangladesh, offering cheaper Chinese products especially cotton and other fabrics central to the garment industry. Its trade with Sri Lanka and Nepal has also quadrupled in recent years. The China-Pakistan nexus has become a huge challenge for India, with the China-Pakistan Economic Corridor set to improve trade relations of the countries with each other as well as its neighbors, increasing both China and Pakistan’s trade share in Asia. Impact of NAFTA and EU The North American Free Trade Agreement created the world’s largest free trade area of 450 million people. It’s an economic powerhouse of $20.08 trillion, as measured by gross domestic product. It links the economies of the United States ($18.5 trillion), Canada ($1.67 trillion), and Mexico ($2.3 trillion). That trade area is greater than the economic output of the 28 countries in the entire European Union. Trade between the three members quadrupled since its formation, from $297 billion to $1.14 trillion. This led to economic growth, profits, and jobs for all three countries. NAFTA boosted trade by eliminating all tariffs between the three countries. It created agreements on international rights for business investors that reduced the cost of commerce. It specially led to growth and investment for small businesses. Another trading bloc, the European Union comprising of 28 neighbouring countries is one of the strongest economic areas in the world. It has 7.3% of the world’s population, but accounts for 23% of the nominal global GDP. Over 52% of UK exports are to the EU. Trade within the EU has increased 30% since 1992. Poorer countries, such as Ireland, Portugal and Spain have made significant improvement in trade since they joined the European Union which has led to their economic growth. Free trade and removal of non-tariff barriers have helped reduce costs and prices for consumers. Increased trade to the EU has created jobs and generated higher income. Step Forward India needs to acknowledge the fact that its future in international trade lies in the sub-continent. There is huge trade potential between India and its neighboring countries. It needs to establish clear and transparent Standard Operating Procedures (SOPs) and re-consider many Non-Tariff Barriers (NTBs) on imports to drastically improve trade relations with its neighbors. The trade policies need to take into account the fact that the neighboring countries do not find Indian products cheap anymore, neither can it afford to look down upon its neighbors since most of the neighboring countries have agricultural and manufacturing sectors that are equally or perhaps more efficient than their Indian counterparts. A step taken by India towards integrating more with the subcontinent is the Chabahar project which would lead to a multi-modal link to Europe through Iran, the Caucasus and Russia. If India provides sub-continental and Indian Ocean linkages, it can be in the connectivity business. India should focus on its economy and observe the One Belt, One Road that is trying to shape the ‘Asian Century’.

Regional Economic Integration in Africa- Possibilities for India
Different parts of Africa have different appetite and liberalization norms for ‘Services’. There is a need for region-specific trade and services negotiations, if India has to gain maximum from an agreement. Historically, reasons for emergence of regional integration arrangements in Africa were political exigencies and economic needs. It is often argued that India should look at Africa not as an aggregation of individual economies, but of regional blocs. This is believed due to macroeconomic weaknesses and small market size of individual African economies. Africa has three major regional economic arrangements- Economic Community of West African States (ECOWAS), Southern African Customs Union (SACU) and Common Market for Eastern and Southern Africa (COMESA). Let’s first understand how European Union (EU), Africa’s biggest trade partner looks at these three. EU’s Approach EU has region specific trade agreements with Africa. An FTA was signed between EFTA and SACU, signed in 2006 and entered into force on May 1, 20081. Economic Partnership Agreement between EU and ECOWAS was finalized in February 2014. And, the EU signed two financing agreements with COMESA- Trade Facilitation programme and Small Scale Cross-Border Trade programme, worth 68 million euros. India’s position India continues to contribute sluggishly to Africa’s total imports, with the share in total imports hovering around 4.5%2 for last three years. FDI stock, however, slowly increased from 12% in 2009 to 15% in 20143. India currently has two memorandums of understanding with ECOWAS and COMESA. If India plans to aggressively take up trade agreements and investment projects in Africa, two identifications are necessary. One, the disparity between different regional blocs of the continent, and the similarities within each such bloc. We now examine the disparity in terms of products and services. Products After analyzing the top 15 exports list of COMESA, ECOWAS and SACU, it can be found that there is a long list of products for each regional trade community, distinct from other blocs. Table 1 lists the product chapters found in top 15 exports to the world by respective regional blocs, which are distinct from other two blocs. COMESA ECOWAS SACU 74, 9, 24, 62, 7, 17, 61, 81, 31 18, 52, 40, 44, 12, 15, 25, 16, 89, 41 87, 84, 72, 76, 22, 73, 28, 38 Table 1: List of distinct product chapters of each bloc 1. Status of Agreements concluded by the Southern African Customs Union States 2. Own calculation based on ITC Trade map database 3. UNCTAD World Investment Report, 2016 This analysis is necessary to understand the distinction in products offered by different regions, and with whom would trade be most beneficial. Services Even though “Memo item- commercial services”, “Transport”, “Travel” and “Other Business Services” occupy the top four slots in services imported by COMESA, ECOWAS and SACU in 2016; the magnitudes of imports differ widely. Other than these top four services, the rankings of service imports vary among these regional blocs. For example, USD 1743.64 million2 worth of “Charges for the Use of Intellectual Property” was imported by SACU in 2016, while COMESA and ECOWAS imported a much less USD 287 million and USD 274.28 million, respectively. Similarly, ECOWAS imported USD 1291.43 million worth of “Financial Services” in 2016, compared to a low USD 204.72 million and USD 104.87 million for COMESA and SACU. This tells us that different parts of Africa have different appetite and liberalization norms for ‘Services’. There is a need for region-specific trade and services negotiations, if India has to gain maximum from an agreement. India’s way forward In a scenario where these regional communities are striving to strengthen trade within them, India can gain significantly if negotiations are directed towards groups, instead of individual countries. Any policy directive should go beyond quantitative facts, and look into the qualitative characteristics of the continent.

India’s growing demand for Solar Panels- Import Substitution or Optimality?
Cheap imports of solar panels have been essential for achievements in National Solar Mission, but with imports acquiring maximum market share, it is expected that domestic manufacturers will be depressed enough to be wiped out from competition. Indian Solar Manufacturer’s Association (ISMA) has appealed in June 2017 for the third time in five years, to the Directorate General of Anti-Dumping (DGAD), to impose anti-dumping duty on solar panels. This time the application is against China, Malaysia and Taiwan. The first two instances of such appeal were in 2012 and 2014, respectively. In 2012, DGAD recommended anti-dumping duty on solar panels imported from China, Malaysia and USA after a complaint from domestic manufacturers. However, the duty wasn’t applied by the Ministry of Finance. Later in 2014, two simultaneous complaints were filed with DGAD and Directorate General of Safeguards (DGS) of Ministry of finance. The complaint was eventually dropped post reassurance, by the government, of future business opportunities for domestic players. Why are domestic manufacturers in distress? India’s total imports of ‘Photovoltaic cells’ (HS code 8541) in 2016 were USD 3,637.41 million[1], 84.5% of which were imported from China. India’s imports from China, Taiwan and Malaysia combined have grown from USD 523.73 million[2] in 2012 to USD 3022.38 million in 2016, showing a compound annual growth rate (CAGR) of 55.99 per cent[3]. Imports from China alone have increased 4.5 times[4] from 2012 to 2015. India’s total export in 2016 for HS code 8541 was USD 159.69 million, a low 4 per cent of total imports. This ratio says something about India’s dependence on imports for solar cells. Previous Cases in Perspective Two precious developments are important for the current discourse. In 2012[5], a DGAD enquiry was initiated for imports from Malaysia, USA, Chinese Taipei and China PR. After a thorough investigation by May 2014[6], it was established by the authority that material injury was caused to domestic industry due to imports at lower than normal value of the products. The authority also noted in their investigation that with anti-dumping duties imposed by the US and EU on Chinese solar panels, its dumping in Indian market can possibly increase. Booming domestic demand would add to the imports. Duties in the range of USD 0.11/watt to USD 0.81/watt were recommended to be imposed. However, the authority also recognized that the cost of solar power production will rise by Rs. 1.6 crore per Mw if anti-dumping duties are imposed on solar panel imports. Finally, the duties were not imposed. Simultaneous to the investigation was another development. India imposed ‘Domestic Content Requirement (DCR)’ on solar cells and modules in the first phase of national solar mission. Later, DCR was extended to thin film technologies. US strategically timed its response and in 2013, complained in the WTO against India’s DCR policy. India, in defence used the ‘government procurement’ clause that permits a deviation from national treatment obligation under the WTO agreement. In 2013 itself, WTO ruled against Canada’s DCR policy in a case petitioned by the EU and Japan. Expectedly, India lost the case. Later in 2016, India’s appeal against the verdict was also rejected by the Appellate Body of the WTO. But in this entire process, India gained four years’ time to comply with WTO’s expected verdict. These two cases bring to light the dilemma that policymakers face while deciding on whether or not to favour the domestic manufacturers. It appears that India should use the clauses that provide for upholding domestic interests; a more fundamental dilemma is if India wants to do so. Case of European Union (EU) and United States (US) The EU recently justified an anti-dumping duty of 47.7 per cent on Chinese solar exports imposed in 2013, post a two year long enquiry into the matter. The investigation revealed that Chinese exporters were selling solar panels at less than market values. A similar finding was made by the US Department of Commerce, following which tariff duties of up to 165.04 per cent were imposed on crystalline silicon photovoltaic solar imports from China and Taiwan. Conflict of Interests With the National Solar Mission’s targets revised five folds upward[7] in June 2015, the government was and still is in a fix to impose such a duty. It’s a clear case of conflicting multiple objectives. The mission aims at ‘reducing the cost of solar power generation’ along with ‘domestic production of critical components and products’- a clear contradiction in objectives in the presence of cheap imports from outside, specifically, China. The Ministry of Non Renewable Energy in a previous anti-dumping duty demand claimed that the duty would not be the right thing because domestic prices are not price competitive. In a scenario where the government is trying to achieve a lower solar energy tariff, it is unlikely that a support mechanism would be used by the state. Way forward or inward? India plans to install a capacity of 10,000 MW of grid interactive power by 2022, out of which 215.67 MW[8] was achieved by April 2017. The importance of solar and other renewable energy becomes more evident in view of the NDCs developed to meet India’s Paris Climate Agreement’s obligations. Cheap imports have been essential for achievements in National Solar Mission, but with imports acquiring maximum market share, it is expected that domestic manufacturers will be depressed enough to be wiped out from competition. On lines of the ‘Sacrifice Ratio’ principle, it can be said that a short term inconvenience of expensive imports can be offset by long term gains of a thriving domestic solar panel industry. But is India ready for the sacrifice? [1] ITC Trade Map database [2] ITC Trade Map database [3] Own calculation based on ITC Trade Map database [4] Own calculation based on ITC Trade Map database [5] Case No.- 14/5/12, Initiation, DGAD, Department of Commerce, GOI [6] Case No.- 14/5/12, Final Findings, DGAD, Department of Commerce, GOI [7] Target revised from 20,000 MW to 100,000 MW by the year 2021-22 [8] MNRE Physical Progress Document, 2017

Rethinking India’s Agricultural Distress
While India aims to improve its competitiveness in export of permitted agricultural commodities and facilitate exports, there is a need to first construct a more farmer-friendly ‘domestic procurement facility’. That, along with a focus on warehousing and processing, is indispensable for a feasible export facilitation initiative. One often misses the paradigm shifts and structural changes happening in agriculture while analyzing its problems. Some issues are ever changing, while some persist. Here, we focus on one such unrelieved stumbling block faced by farmers. Lately, low farm incomes are being deemed, and rightfully so, as a prime reason for agrarian distress. Following this realization, the objective of ‘doubling farm incomes by 2022’ expectedly found its way into the Union Budget of 2017. But what is it that really constitutes the hurdles that keep farmers from raising their farm incomes, is it just an external force such as below-normal monsoons and lack of technological up gradations, or are there inbuilt impediments too. We intend to look at two such bottlenecks- domestic procurement procedures and storage facilitation. Consider a situation where a farmer needs to spend an entire day to sell his produce to procurement agencies. Following the sale, which is often at lower prices for the ones who are towards the end in queue, is a seven to nine day long wait for payment to be credited in the farmer’s bank account. Not to forget, the procurement process requires Origin Certificate and Aadhar Card to be furnished by the farmer. Although Aadhaar’s penetration has significantly improved in India, obtaining the Origin Certificate from the village patwari remains a challenge for farmers. Whether it is absence of the issuing authority or mere reluctance of getting work done, it is the farmer who suffers. It is a question if the documentation is really facilitating the procurement process or restricting it, in a situation where the government agencies represent a monopsony, naturally rendering the bargaining power of farmers meagre. This discussion would be incomplete if we do not consider the role middlemen play in the scene. Middlemen are traders who buy agricultural produce from farmers and further sell it where higher prices are ensured. A typical arrangement is one in which the middleman offers 50 percent of the MSP to the farmer, with immediate cash payment. Putting this and the previous situation in perspective, one can see that farmers without adequate documents and in need of cash are prone to selling their produce to middlemen, compromising on their farm incomes. It is with this conundrum that one needs to understand the endogenous factors contributing towards low incomeof farmers. Low bargaining power and inability to hold the produce result also from a persistent drawback in Indian agriculture- poor storage standards and lack of processing units. According to a 2010 study by Central Institute of Post Harvest Engineering and Technology (CIPHET), Ludhiana, an estimated harvest and post-harvest loss of Rupees 44,143 crore per annum (at 2009 wholesale prices) was incurred . Adequate processing facilities, preceded by ample storage for harvest, are essential requirements for remunerative prices of agricultural produce, and consequently for raising farm incomes. To conclude, in times as stressful for agriculture as now, it becomes imperative to rethink the issues and look within the sector for solutions. While India aims to improve its competitiveness in export of permitted agricultural commodities and facilitate exports, there is a need to first construct a more farmer-friendly ‘domestic procurement facility’. That, along with a focus on warehousing and processing, is indispensable for a feasible export facilitation initiative. If the nation can’t secure the interests of the primary stakeholder of a sector, the growth path cannot be sustained.
G20 Summit- What should be India’s agenda?
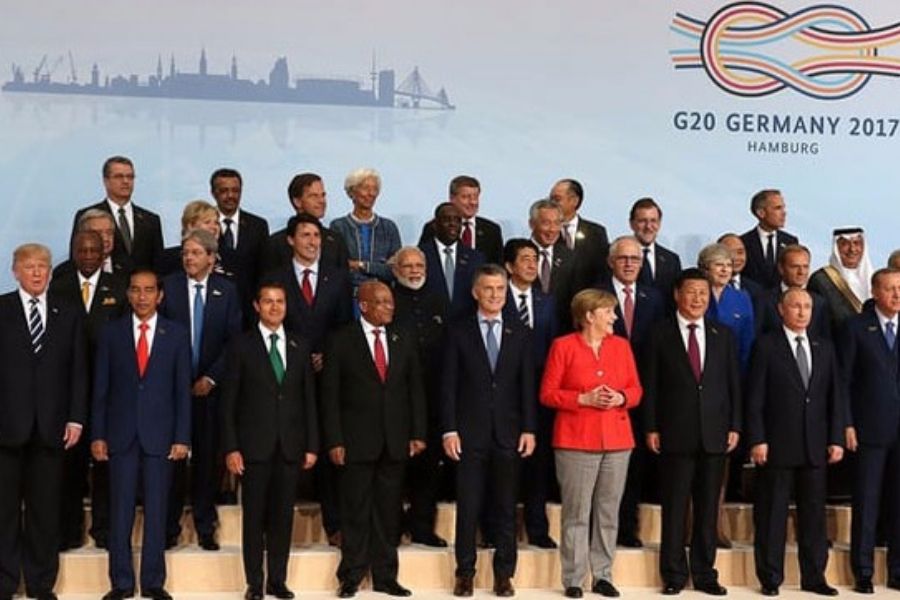
A revived thrust on climate conundrum along with a dominant strategy for agriculture should top the priority list of all the concerned countries in the G-20 meeting at Hamburg, Germany. Image Credit: WHO Twelfth G-20 Summit will be held on 7th and 8th July, 2017 in Hamburg, Germany. It’s a premier forum for economic cooperation and to discuss the challenges faced by its member countries. There are many pressing issues which the member countries including India would want to address at the Summit. But it is important to prioritize the issues. Agriculture is one such issue which cannot wait. India’s agricultural economy is in a deep crisis, if not addressed urgently can have dire environmental, societal and economic implications. State of Indian agriculture Food Sustainability Index (FSI), which ranks 25 countries according to the sustainability of their food systems, is a quantitative and qualitative measure. It measures the sustainability across three pillars- food loss and waste, sustainable agriculture and nutritional challenges. India was ranked 25th in 2016 with a score of 43.17 (out of 100). The most notable defects faced by India’s food system are- unsustainable use of groundwater, low quality agricultural subsidies and poor nutritional status. India is the biggest consumer of groundwater in the world. Agriculture has started to threaten the water supplies. Though the record of water irrigation is not very impressive and there has been a decline in surface irrigation, the increasing use of tube well irrigation has led to depletion of ground water. Groundwater Development Index, which measures ratio of groundwater consumed to groundwater recharged is just 60% in India. It was claimed that the use of Genetically Modified (GM) varieties can help India overcome the agricultural crisis. In reality, it has worsened the agricultural scenario. Use of GM varieties has eventually led to an increase in the use of pesticides, herbicides and insecticides which has in turn polluted the already depleting groundwater and soil. As per the Agreement on Agriculture (AOA), all the countries especially the developed ones need to limit the extent of support given to agriculture by reducing their subsidies (which can distort trade and production). To think that developed countries are not giving subsidies to their farmers is a myth. Their current stance can be termed as box shifting, that is, subsidies have moved from being direct to indirect. These subsidies do have trade distorting effects and hit the poor farmers in our country. Food security is one of the most severe challenges faced by us today. Deep linkages of agriculture and environment The correlation between agriculture and environment is robust. The resources of the country are under great strain due to the negative environmental impact of agriculture. India also received the lowest scores under FSI for overall greenhouse gas emission with sources including machinery, fertilizers, pesticides, soil erosion etc. India contributed 6.3% of global C02 in 2015 and its carbon emission from burning fossil fuel increased by 5.2 % in the same year. Paris Climate Agreement, which aims at cooperating towards the common aim of developing climate friendly, efficient and sustainable solution for expanding energy needs and other areas of sustainable development, is a crucial agreement for India in many ways. In order to revive agriculture and make it sustainable, it is essential to adopt agricultural practices that curb climate change; and agriculture has a huge unrealized potential to mitigate climate change. To realize that potential and increase the resilience of this sector, India needs to push for the agreement at the Summit. India is not the only country trying to solve this complex puzzle of dealing with agricultural and environmental issues. Least developed countries (LDCs) and developing countries like Argentina, China, Brazil, Indonesia and most of the African countries are in the same fix. A revived thrust on climate conundrum along with a dominant strategy for agriculture should top the priority list of all the concerned countries in Hamburg. A united effort at negotiations is the need of the hour.