When summer settles over India, the air grows heavy with sweetness, and the syrupy perfume of mangoes drifts through markets, kitchens, and homes. Buckets of the fruit soak in cool water, children wait for their turn with dripping slices, and across cities and villages, families exchange boxes of Alphonsos as tokens of love. Mangoes are no longer just a sign that summer has arrived in India. The fruit today carries a deeper meaning. It has become a taste of India that the world eagerly awaits. The King of fruits has grown into an instrument of soft power. Every summer in India, the air turns sweet long before the first mango reaches the plate. The scent of ripening fruit drifts through markets and homes. Summer afternoons in a typical Indian household comprise of buckets brimming with mangoes soaking in cool water, waiting to be sliced, shared, and savored after meals. Across the country, families send boxes of mangoes from their farms or local markets to relatives and friends, as a gesture of affection. For many, the season’s joy lives in the simple comfort of aamras after lunch or a tall glass of mango shake shared on a hot afternoon. Mangoes are deeply rooted in the Indian culture. But now, it is more than a yearly ritual of taste and in recent years, this familiar joy has taken on a new meaning. The mango, India’s “king of fruits,” is now also a quiet ambassador of India’s global reach – one of soft power, trade, and cultural pride. In FY25, India’s mango exports touched 32,000 metric tonnes, valued at US$ 60.14 million, marking a steady rise in both demand and reach. Bengaluru’s Kempegowda International Airport alone shipped 3.15 million mangoes to 51 global destinations, with exports expanding 12% in volume and 21% in reach. The fruit’s journey now stretches from Indian farms to supermarket shelves in the UAE, UK, Japan, Saudi Arabia, and the USA, carried by 24 international airlines. For a crop so deeply woven into India’s heritage, this global ascent carries both economic and emotional weight. India produces nearly half of the world’s mangoes—over 20 million metric tonnes annually—yet exports remain relatively modest. This paradox of abundance and under-representation is familiar to Indian agriculture, but in the case of mangoes, the story runs deeper. It’s not just about supply chains or shelf life; it’s about reimagining how a cultural icon can evolve into an economic powerhouse. The sweet symbol of soft power and the bottlenecks For India, the mango has always carried meaning far beyond its taste. It has travelled through time as a cultural and diplomatic messenger—gifted between rulers, celebrated in poetry, and now, presented in diplomatic exchanges. In recent years, mangoes have featured in high-level bilateral visits, notably as gifts to nations like Japan and the UAE. These gestures, while symbolic, highlight the potential of transforming a fruit into a brand of national pride. Imagine an “Alphonso from India” campaign—backed by the Agricultural and Processed Food Products Export Development Authority (APEDA) and state governments—elevating the fruit to the status of Champagne or Parmigiano-Reggiano. With its GI tag and rich aroma, Alphonso can represent the gold standard of Indian produce—a product that speaks of terroir, tradition, and taste. But the path from orchard to overseas market is still uneven. Strict phytosanitary restrictions continue to limit access to high-value destinations such as Australia and South Korea. The Ministry of Commerce has noted that pest-related concerns and a shortage of approved irradiation facilities have slowed negotiations for export protocols. Add to that the mango’s short shelf life and weather-sensitive yield, and consistency quickly becomes a major hurdle. Certification is another key barrier. Labels such as GLOBALG.A.P., HACCP, and Fairtrade, essential for European and North American retail access, remain rare among Indian mango exporters. The National Horticulture Board (NHB) has flagged this as an area needing urgent investment, calling for more pack houses, vapor heat treatment units, and traceability systems across mango-growing states. These gaps are not due to lack of intent, but infrastructure. The challenge is to match India’s natural advantage with global-grade systems that guarantee quality, safety, and reliability. Several policy interventions are now helping bridge these gaps. Financial assistance under APEDA supports the creation of packhouses and branding initiatives, while the Transport and Marketing Assistance (TMA) scheme offers freight cost reimbursements for agri-exports. The PM Formalisation of Micro Food Processing Enterprises (PMFME) scheme is encouraging small entrepreneurs engaged in mango pulp and beverage processing, and the Agri Infrastructure Fund (AIF) provides low-interest loans for cold chains and logistics. These interventions, along with the EPCG scheme for duty-free machinery imports, are strengthening the value chain from farm to port. What India needs next is greater awareness and adoption of these schemes at the grassroots level. Rising demand, emerging markets Export data reflects encouraging momentum. India’s mango shipments are gaining traction not just in traditional markets such as the UAE, Saudi Arabia, and the UK, but also in emerging regions like East Africa and Central Asia. Premium destinations like Japan, South Korea, and the United States are showing growing appetite for high-quality, residue-free varieties. Among India’s many cultivars, the Alphonso from Maharashtra, Kesar from Gujarat, and Banganapalli from Andhra Pradesh stand out for their export suitability. The Alphonso’s aroma and GI protection make it a premium product, while Banganapalli’s longer shelf life makes it ideal for fresh export. The tangy Totapuri, meanwhile, dominates the processed pulp segment, underscoring how each variety can find its niche in global trade. If India wants to claim a larger slice of the global mango market, technology and traceability will be crucial. Digital tracking and QR-coded packaging can assure international buyers of authenticity and quality. Linking this with blockchain-enabled mandis and eNAM platforms can create transparency from farm to fork—a feature global consumers increasingly demand. Equally vital is brand storytelling. India’s mangoes are more than commodities; they are carriers of culture. A cohesive branding effort that links India’s dive rse mango varieties to their regional heritage

India’s rapeseed output set for record high amid soaring Chinese demand
India’s rapeseed cultivation is expected to hit a record high, supported by strong Chinese demand and favourable weather. The crop area has expanded 7–8%, with early sowing up 13.5% from last year. Exports of rapeseed meal to China have surged to 488,168 tons in the first half of FY2025, up from 60,759 tons in all of 2024–25, after Beijing imposed tariffs on Canadian imports. Robust demand and output could help India reduce dependence on costly edible oil imports. As the world’s third-largest producer, India contributes over 13% to global output, with production rising 66% in a decade due to better seeds and farming practices. Experts emphasize promoting high-yielding varieties and quality inputs to bridge yield gaps, boost self-sufficiency, and enhance farmer incomes. India’s rapeseed cultivation is set to reach a record high this year, driven by strong Chinese demand for rapeseed meal and favourable growing conditions following above-average rainfall. As the country’s key winter-sown oilseed, higher rapeseed output could significantly reduce India’s dependence on costly imports of edible oils. According to industry estimates, the total area under rapeseed and mustard cultivation is expected to expand by about 7%–8% this year. Farmers typically sow the rapeseed crop in October and November, and by early November they had already planted 4.17 million hectares—13.5% more than during the same period last year. Last year, India’s total rapeseed area stood at 8.93 million hectares, well above the five-year average of 7. 9 million hectares. According to Mr B.V. Mehta, Executive Director of the Solvent Extractors’ Association of India, the domestic demand for rapeseed oil has been robust this year, while exports of rapeseed meal have soared, mainly due to record purchases from China. The Chinese buyers turned to India after Beijing imposed a 100% retaliatory tariff on rapeseed meal and oil imports from Canada, its leading supplier, in March. During the first half of the current fiscal year starting April 1, China imported an unprecedented 488,168 metric tons of rapeseed meal from India—compared with just 60,759 tons during the entire 2024–25 fiscal year, according to the association data. Export growth and trade performance In 2024, the United States stood as India’s top market for rapeseed and mustard oil exports, valued at US$ 4.9 million and representing 20.7% of total exports. Other key destinations included Canada, the United Arab Emirates, Australia, and Qatar. Table: India’s export of rapeseed, colza, and mustard oil Country 2024 (US$ Million) Share in India’s exports (%) USA 4.9 20.7 Canada 4.1 17.4 UAE 3.4 14.5 Australia 2.3 9.6 Qatar 1.0 4.1 Source: Trade map According to the latest trade data by Department of Commerce, India’s exports of rapeseed, colza, and mustard oil (HS Code 1514) have shown robust growth in 2025. In August 2025, exports rose to US$ 2.49 million, marking a 36.18% increase from US$ 1.83 million in August 2024. Over the five-month period from April to August 2025, cumulative exports reached US$ 11.33 million, up 28.53% from US$ 8.81 million recorded during the same period in 2024. This sharp rise reflects strong international demand for Indian rapeseed and mustard oil, supported by favourable domestic production trends and expanding export opportunities. The surge in exports, combined with strong domestic demand, has kept rapeseed prices comfortably above the government’s minimum support price (MSP) of ₹5,950 per 100 kg for last year’s crop. For the current season, New Delhi has raised the MSP by 4.2% to ₹6,200 per 100 kg. Industry experts point out that rapeseed contains a higher oil content than soybeans, and if the strong planting trend continues, it could help moderate the rise in India’s edible oil imports. Currently, India meets nearly one-third of its cooking oil demand through imports of palm, soybean, and sunflower oils from Malaysia, Indonesia, Brazil, Argentina, Ukraine, and Russia. Evolving production dynamics and future trajectory India ranks as the world’s third-largest producer of rapeseed-mustard, contributing over 13% to global output between 2020–21 and 2024–25. However, its average yield of 1,461 kg/ha in 2024–25 remains just 60.7% of the global average of 2,070 kg/ha. As a key oilseed crop, rapeseed-mustard holds the second position in India’s oilseed economy after soybean and accounts for nearly 36% of domestic edible oil production. Grown across 24 states, the crop’s adaptability, short growth duration, and versatility make it especially valuable for small and marginal farmers in rain-fed regions. Over the past two decades, joint initiatives by the Government of India, ICAR, and various state governments have significantly boosted production—from 6.8 million tons in 2015–16 to 12.61 million tons in 2024–25. This reflects a 66% rise in production (CAGR 2.7%) and a 41% improvement in productivity (CAGR 1.8%), driven by technological innovations, better seeds, and improved farming practices. Despite notable progress, productivity remains constrained by yield gaps and limited farmer awareness of advanced technologies. According to experts, strengthening key areas such as promoting high-yielding seed varieties and improving access to quality inputs to address regional disparities will be essential for sustaining rapeseed-mustard’s contribution to India’s edible oil security and enhancing farmer incomes. Read more Rapeseed Planting Jumps In India As China Demand Rises Impact evaluation on productivity and profitability of rapeseed-mustard under cluster front line demonstration in Chandel district, Manipur FAQs 1. Why is India’s rapeseed cultivation expected to reach a record high this year? India’s rapeseed area is expanding due to strong Chinese demand for rapeseed meal, favourable weather following above-average rainfall, and steady domestic demand for edible oil. These factors have encouraged farmers to increase sowing by about 7–8% compared to last year. 2. How has Chinese demand influenced India’s rapeseed exports? China’s record imports of rapeseed meal from India—488,168 metric tons in the first half of FY2025—have significantly boosted India’s export performance. This surge followed China’s imposition of a 100% tariff on rapeseed imports from Canada, redirecting demand to India. 3. What impact does higher rapeseed output have on India’s edible oil imports? Higher rapeseed production can help India reduce its dependence on imported edible oils such as palm, soybean, and sunflower oil. As rapeseed

India tops global charts in alcohol consumption growth
India has emerged as the world’s fastest-growing beverage alcohol market, topping 20 key global economies for the third consecutive half-year period, according to the latest IWSR data. Total beverage alcohol consumption in the country rose 7% year-on-year in the first half of 2025, crossing 440 million 9-litre cases. The surge is being powered by a young and expanding consumer base, rising disposable incomes, and a growing preference for premium and craft segments — with Indian whisky continuing to lead the market. As per the IWSR data, India posted the highest growth in total beverage alcohol (TBA) consumption among 20 major global markets for the third consecutive half-year period, marking a 7% year-on-year rise in the first half of 2025. India’s beverage alcohol market is entering a new phase of transformation, driven by favourable demographics, rising incomes, and evolving consumer preferences. While the market is still less developed than those in mature economies such as the US, Japan, or Germany, its growth trajectory has been remarkable. The country’s total beverage alcohol volume has now surpassed 440 million 9-litre cases, positioning India as one of the most dynamic alcohol markets in the world. A major factor behind this surge lies in India’s vast population and the rapid expansion of its middle class. With a young demographic base and increasing urbanisation, the number of consumers with the purchasing power and aspiration to trade up to premium products has grown significantly. The population aged between 25 and 45 years — the core drinking-age cohort — is driving both volume and value growth. This, coupled with evolving social norms and a growing appetite for experimentation, has made India one of the most attractive growth markets for global and domestic alcohol producers alike. However, what is equally notable is the regulatory transformation underway across several Indian states. Historically, the country’s beverage alcohol industry has been hindered by complex, bureaucratic, and highly localised regulatory structures. Each state maintains its own excise policies, taxation systems, and distribution models, which has long posed challenges for producers and marketers. In recent years, though, a shift has begun. Key state governments have started adopting a more pragmatic and business-oriented approach, recognising the industry’s immense contribution to state revenues and employment generation. Excise duties on alcoholic beverages constitute one of the largest sources of non-GST revenue for many Indian states. As such, state policymakers are increasingly viewing the sector through a developmental lens rather than a purely regulatory one. Simplified licensing procedures, digitalisation of permits, and revised excise policies aimed at attracting investment are now being observed in states such as Maharashtra, Haryana, and Karnataka. This gradual easing of bureaucracy, while uneven across the country, is paving the way for greater operational efficiency and faster product rollouts, ultimately fuelling industry expansion. IWSR data shows that spirits positioned at the higher end of the standard price range and above are outperforming value segments, indicating an overall quality enhancement among domestic distillers. Indian whisky, in particular, continues to dominate the spirits landscape, growing by 7% to exceed 130 million 9-litre cases. At the same time, segments such as vodka and gin are witnessing double-digit and steady single-digit growth respectively, reflecting diversification in consumer choices. In both absolute and percentage GDP growth terms, developing markets like India are forecast to outperform mature economies over the coming decade. This strong macroeconomic foundation aligns closely with IWSR’s projections for beverage alcohol value growth. As income levels rise and aspirations shift toward higher-quality consumption, more Indian consumers are gravitating toward premium and imported brands, especially in urban centres and emerging Tier-II cities. Among global developing markets, India and China stand out as the twin engines of growth for the beverage alcohol industry. Both countries exhibit robust consumer confidence, with respondents showing optimism about their personal financial situations and reporting strong gains in alcohol spending. While data from China may skew positively due to cultural factors influencing self-reporting, India’s optimism is grounded in a real and measurable rise in disposable income, lifestyle changes, and exposure to global consumption patterns. Moreover, India’s growth story in beverage alcohol is being reinforced by structural shifts in distribution and marketing. The proliferation of e-commerce platforms, the rise of modern retail, and the evolution of on-trade experiences — such as premium bars, craft breweries, and mixology-focused lounges — are redefining how consumers discover and engage with alcoholic beverages. Although e-commerce sales of alcohol remain restricted in many states, pilot projects and discussions around regulated digital sales channels hint at potential future liberalisation. The diversification of consumer tastes has also given rise to new growth pockets. Niche categories such as Irish whiskey, agave-based spirits, and Indian single malts are expanding at a rapid pace, catering to a growing segment of discerning drinkers. Notably, Indian single malts are steadily gaining ground on Scotch malts, as local producers focus on innovation, craftsmanship, and regional authenticity. At the same time, ready-to-drink (RTD) beverages and low-alcohol options are resonating with younger, health-conscious consumers who value convenience and moderation. IWSR’s long-term outlook projects India to become the fifth-largest alcohol market globally by volume by 2027, overtaking Japan and later Germany by 2033. With China, the US, Brazil, and Mexico expected to remain ahead, India’s rise signifies a fundamental shift in global industry dynamics. Read more India’s alcoholic beverage industry is in high spirits! Indian whiskey brands have an opportunity to move up the ladder FAQs 1. Why is alcohol consumption rising in India?A young population, higher incomes, urban lifestyles, and growing social acceptance are driving alcohol consumption in India. 2. Which alcohol category dominates the market?Whisky leads the market, followed by rum, vodka, gin, and ready-to-drink beverages. 3. How big is India’s alcohol market now?India crossed 440 million 9-litre cases in total beverage alcohol sales, making it the fastest-growing among 20 global economies. 4. What is driving premiumisation in India’s alcohol industry?Consumers are increasingly choosing premium and craft brands as incomes and global exposure rise. 5. What’s the outlook for India’s alcohol sector?India is projected to become the

India’s UPI success story: Scale, speed, and inclusion
India’s digital payments landscape has witnessed an extraordinary surge, led by the Unified Payments Interface (UPI), which now accounts for over 85% of all digital transactions. Backed by the Aadhaar stack, Jan Dhan accounts and widespread smartphone access, UPI has reshaped both person-to-person and merchant payments, penetrating rural markets and enabling seamless micro-transactions. Cross-border UPI linkages and real-time settlement infrastructure have cemented India’s role as a global fintech pioneer. New features—credit-on-UPI, conversational and offline payments, and advanced fraud-monitoring systems—are broadening its reach. As merchant participation grows and public-private collaboration deepens, UPI continues to drive a secure, inclusive and interoperable digital economy. India’s payments ecosystem has seen extraordinary growth, with digital payments now dominating the country’s transaction landscape. In the first half of 2025, digital payments accounted for 99.8% of total transactions by volume and 97.7% by value, according to the Reserve Bank of India (RBI). Out of total payment transactions worth ₹1,572 lakh crore, ₹1,536 lakh crore were conducted digitally. These figures reflect a steep progression over the past decade. In 2019, digital transactions made up 96.7% of volume and 95.5% of value. However, these shares had climbed to 99.7% (volume) and 97.5% (value) in 2014. Digital transactions have surged 38-fold in volume and three-fold in value over ten years, clocking a CAGR of 52.5% in volume and 13% in value for the decade ending 2024. Over the past five years alone, digital payments have grown 6.6 times in volume and 1.6 times in value, translating to a five-year CAGR of 46% in volume and 10% in value. UPI leads India’s retail payment transformation India’s digital payments infrastructure includes a diverse mix of instruments such as UPI, IMPS, NEFT, RTGS, cards, mobile wallets, and net banking. Among these, the Unified Payments Interface (UPI) has emerged as the most widely used fast payment system, driven by its ease of use, 24×7 functionality, and quick settlement features. In H1 2025, UPI processed 10,637 crore transactions worth ₹143.3 lakh crore, compared to ₹117 lakh crore in the same period of 2024. It accounted for 85% of payment transactions by volume, but only 9% by value during the first six months of 2025, highlighting its role as the preferred platform for frequent, low-value retail payments. In contrast, RTGS and CCIL systems handle high-value wholesale transfers, with RTGS requiring a minimum of ₹2 lakh per transaction, making them central to India’s Large Value Payment System infrastructure. Together, these systems demonstrate India’s rapidly advancing digital payments ecosystem, driven by strong infrastructure, widespread user adoption, and supportive regulatory policies. UPI: When India reimagined money and inclusion UPI’s story started not with an app, but with a bold idea: enabling India, a nation of over a billion people, to skip traditional banking barriers and enter the digital age seamlessly. This transformation was built on what policymakers later termed “Digital Public Infrastructure,” driven by three foundational reforms. Jan Dhan Yojana enabled millions to open bank accounts and join the formal financial system. Then Aadhaar provided every citizen with a biometric identity, allowing seamless digital verification. Affordable mobile data, propelled by intense telecom competition, gave mass internet access to even low-income users. With this groundwork laid, NPCI launched UPI in 2016 as an open, interoperable platform. Unlike closed digital wallets, UPI allowed real-time bank-to-bank transfers across any app. Its simplicity changed the game—no wallet top-ups, no app exclusivity, just instant secure payments from any bank to any bank, making digital finance truly universal and inclusive in India. How UPI works? Unified Payments Interface (UPI) is a real-time payment system that allows users to link multiple bank accounts to a single mobile application from any participating bank. It brings together various banking services, seamless fund transfer options, and merchant payments on one platform. UPI also supports peer-to-peer payment requests, enabling users to send or schedule payment requests conveniently. The system was launched in pilot mode by the National Payments Corporation of India (NPCI) with 21 member banks. The pilot was officially unveiled on April 11, 2016, in Mumbai by then RBI Governor Dr. Raghuram G. Rajan. Following the launch, participating banks began releasing their UPI-enabled applications on the Google Play Store, making it accessible to users nationwide. UPI functions through key participants including the Payer Payment Service Provider (PSP), Remitter Bank, NPCI, Beneficiary Bank, bank account holders, and merchants. Together, they enable smooth fund transfers across banks and platforms. UPI offers several benefits to customers, merchants, and banks. It operates 24×7, enabling instant transfers anytime. Users can access multiple bank accounts through a single app and make secure payments using a Virtual Payment Address (VPA), eliminating the need to share sensitive details. The platform supports single-click, two-factor authentication and allows users to raise complaints directly through the mobile app. What makes UPI exceptional is- Enables instant money transfers via mobile, 24×7×365. Allows access to multiple bank accounts through a single app. Offers seamless one-tap payments with secure, RBI-compliant two-factor authentication. Uses a Virtual Payment Address (VPA) for added security—no need to share card numbers, account details, or IFSC codes. Supports QR-code-based payments. Eliminates cash-on-delivery hassles, ATM visits, and the need for exact change. Facilitates merchant payments through one app or in-app integrations. Simplifies utility bill payments, over-the-counter payments, and QR (scan-and-pay) transactions. Enables donations, collections, and disbursements at scale. Allows users to file complaints directly through the app. UPI serves a wide range of payment needs — from utility bills and retail shopping to donations, collections, and disbursements — making it extremely adaptable. By removing the hassles of exact cash payments and reducing reliance on ATMs, it simplifies daily transactions. This broad utility and convenience make UPI a powerful, scalable, and efficient digital payment solution for both consumers and merchants. India’s UPI goes global Building on this strong momentum, the National Payments Corporation of India (NPCI) has increased the Unified Payments Interface (UPI) transaction limit for Person-to-Merchant (P2M) payments. Effective 15 September 2025, users can now make merchant payments of up to ₹10 lakh per day in select verified categories,

The new rural dividend: Converting farm waste into clean energy and income
Every winter, smoke from stubble fires blurs India’s northern skies, a symptom of an untapped resource going up in flames. What if, instead of pollution, those residues powered the grid, created rural jobs, and cut fossil fuel use? The answer lies in reimagining agricultural biomass as a national energy asset. India’s claim as an agricultural powerhouse is well earned. With nearly 139 million hectares under cultivation, its farms do far more than feed the nation. They generate a vast and often overlooked stream of by-products. Crop residues, husks, sugarcane fibre, palm and coconut shells, even cow dung which all accounts to an abundant supply of agricultural biomass. Yet, despite its scale and potential, this resource remains on the fringes of India’s energy and rural enterprise story. India produces an enormous volume of agricultural residues every year with an estimated 500–600 million tonnes in total. Of this, rice and wheat alone account for nearly 70%, with studies suggesting around 120–230 million tonnes of rice straw and husk and 110–130 million tonnes of wheat straw annually. Residues from crops such as cotton, sugarcane, and coconut add significantly to this pool, even if precise figures vary across regions. Collectively, India’s annual agricultural biomass output ranks among the highest in the world, second only to China, with a surplus potential of about 230 million tonnes available for productive use. These are not just statistics — they represent a vast, renewable resource waiting to be transformed into value and opportunity. For farmers, even a modest payment can deliver meaningful revenue. In several Indian states, raw agricultural biomass currently changes hands at an average of ₹ 1.5–₹ 2 per kg, which translates to a serviceable available market (SAM) in the region of ₹ 15,000–₹ 20,000 crore. For marginal and smallholder farmers, this means a dependable supplementary income stream — achieved without additional land or major input costs. Yet the promise is held back by structural frictions. The biomass market remains largely unorganised. Mechanisation along the agricultural-residue chain is uneven, farms are fragmented, and the costs of storage and transport continue to erode margins. For instance, a detailed supply-chain review for paddy residue indicates that transport and aggregation up to ~15 km can cost ₹ 1,150-₹ 1,330 per tonne (≈ ₹ 1.15–₹ 1.33 per kg) even before longer-haul costs kick in. In the broader logistics landscape, India’s freight transport is expensive -road transport averages ₹ 11.03 per tonne-km. These cost pressures make long-haul aggregation of light volumes uneconomic, ultimately squeezing both farmers and processors. If biomass is to emerge as a durable pillar of rural livelihoods and clean energy, then the system must evolve — from ad-hoc collection to an organised, localised ecosystem that links farmers, cooperatives, rural entrepreneurs and energy producers. Only by reducing friction and raising value at each stage can this latent opportunity be realised in scale. Practically, this means incentivising collection and storage close to source. Corporate players and cooperatives should be encouraged to set up structured collection and storage facilities in agricultural pockets so raw material need not travel excessively long distances. Area-wise biomass collection agents — local entrepreneurs or cooperative cadres can be deployed to aggregate feedstock from clusters of villages. These agents, working with farmers, will funnel material into strategically located “collection banks” that saturate catchment areas and ensure consistent supply. Price signals must be clear and remunerative. Offering attractive, stable prices to farmers and collection agents will make biomass trading a viable line of business; policymakers might also explore a Minimum Support Price (MSP) mechanism for raw biomass to stabilise supply and protect small sellers from price shocks. Equally important is institutional partnership: tying up multi-state farmer cooperatives and agricultural societies can bring scale, accountability and traceability into the supply chain. Finally, the logic of scale must meet the logic of geography. Processing should sit where collection happens. Locating bioenergy and biogas plants close to storage clusters or high-density production zones not only reduces transport costs but also lowers carbon intensity and enhances plant viability. When feedstock, logistics, and processing are co-located, the economics align for every participant in the chain — farmers earn an assured price, collection agents gain steady income, and energy producers secure reliable raw material at predictable costs. The dividends extend far beyond economics. A functional farm-to-fuel ecosystem would substantially reduce stubble burning, improve local air quality, generate rural employment, and reinforce India’s clean energy transition. Crucially, it would convert what is today a waste-disposal problem into a sustainable income stream for millions of farmers. India already possesses the raw material base, nearly a billion tonnes of agricultural biomass annually. What’s missing is organisation and integration. Through pragmatic incentives, district-level biomass aggregation models, and public–private collaboration in logistics and technology, farm residue can evolve into a dependable pillar of India’s renewable energy portfolio. Our farmers have long been the custodians of food security; with the right systems and market linkages, they can now become anchors of energy security — powering a rural renaissance grounded in both sustainability and shared prosperity. Joint Director – Trade Promotion Council of India (TPCI)

India’s industrial growth holds steady at 4% in September
India’s industrial output grew 4% year-on-year in September 2025, maintaining August’s pace, though underlying momentum was mixed. Manufacturing, which rose 4.8%, drove growth, while mining contracted 0.4% and electricity generation increased 3.1%. Core sector growth slowed to 3%, weighed down by declines in refinery products, natural gas, and crude oil, despite strong steel and cement output. Consumer durables and infrastructure goods showed robust expansion, but non-durables fell. Although festive demand, GST rate cuts, and pent-up consumption boosted short-term momentum, analysts cautioned that sustaining growth beyond the festive period could be challenging amid subdued domestic demand and persistent global headwinds. India’s Index of Industrial Production (IIP) registered a year-on-year growth of 4% in September 2025, maintaining the same pace as August’s quick estimate. The IIP stood at 152.8 compared to 146.9 in September 2024, reflecting continued momentum in industrial output. According to data from the Ministry of Commerce and Industry, growth in the eight core industries slowed to 3% in September from 6.5% in August, as declines in refinery products, natural gas, and crude oil output offset the gains recorded in steel and cement production. Notably, Steel output jumped 14.1% and cement rose 5.3%, driven by strong infrastructure activity. However, refinery production fell 3.7%, natural gas declined 3.8%, and crude oil dipped 1.3%, reflecting persistent weakness across India’s energy-producing sectors. Manufacturing leads growth Manufacturing remained the primary growth driver, with output rising 4.8% compared to about 4% a year earlier. Strong performances were recorded across several core industries. According to analysts, the robust growth in manufacturing was underpinned by double-digit expansion in key industries, including basic metals, electrical equipment, computer and electronic products, motor vehicles, and wood products. Production of basic metals jumped 12.3%, electrical equipment soared 28.7%, and motor vehicles, trailers and semi-trailers rose 14.6% over the same month last year. Electricity generation also showed improvement, rising 3.1% in September 2025 against a modest 0.5% growth in the year-ago period, indicating increased energy demand in both industrial and household sectors. Meanwhile, the National Statistics Office (NSO) revised the IIP growth for August 2025 slightly upward to 4.1% from its provisional estimate of 4%. However, on a half-yearly basis, industrial growth has moderated. During April–September (H1) FY26, overall industrial production expanded by 3%, lower than the 4.1% growth recorded during the corresponding period of FY25. Use-based categories show mixed performance Manufacturing, accounting for nearly 78% of the IIP — remained the key driver of growth. The sector expanded 4.8% year-on-year in September, improving from 3.8% in August and 3.9% in the same month last year. Mining output, impacted by heavy rains in parts of the country, declined by 0.4% year-on-year in September, reversing a strong 6.6% expansion in August and a marginal 0.2% increase recorded in September 2024. Performance across use-based categories showed mixed trends. Production of capital goods, intermediate goods, infrastructure/construction goods, and consumer durables recorded sequential improvements, while output of primary goods slowed and consumer non-durables declined. Capital goods output increased 4.7% in September compared to 4.5% in August, while intermediate goods rose 5.3%, slightly higher than 5.2% previously. Infrastructure and construction goods maintained strong growth at 10.5%, up marginally from 10.4% in the prior month. Consumer durables reported the sharpest gain, surging 10.2% year-on-year versus 3.5% in August. In contrast, primary goods output grew just 1.4%, down from 5.4% in the previous month, while consumer non-durables contracted by 2.9%, following a 6.4% decline in August. Industrial recovery uneven amid global and domestic headwinds According to analysts, India’s industrial growth in September 2025 reflected a fragile and uneven recovery, highlighting persistent challenges amid subdued domestic demand, global economic uncertainties, and sector-specific constraints. Industrial performance during FY26 has remained volatile — slowing in the first quarter (April–June) before picking up momentum from July onwards. The latest Index of Industrial Production (IIP) data suggests that while some sectors are regaining strength, overall recovery remains patchy and dependent on consumption dynamics and external factors. Growth in the core infrastructure industries, which make up over two-fifths of the country’s industrial output, eased to a three-month low in September, with production up 3% year-on-year, according to provisional data. Analysts noted that despite the moderation in industrial growth, a mix of GST rate rationalisation, pent-up demand, and an early festive season has boosted consumption during September–October 2025. They added that GST reductions for the FMCG sector are expected to show a more visible impact in October and November, as dealers earlier struggled to sell products with older price labels. These factors are also likely to support manufacturing activity in the coming months. However, the analysts cautioned that while GST cuts may help sustain demand for everyday and lower-value goods, demand for high-value or big-ticket items may weaken post-festive season. Read more: Quick estimate of index of industrial production and use-based index for the month of September 2025 India’s industrial production slows to 4% in September India’s Industrial Development Report 2024-25 FAQs: 1. What was India’s industrial growth rate in September 2025? India’s Index of Industrial Production (IIP) grew 4% year-on-year in September 2025, maintaining the same pace as August’s quick estimate. The IIP stood at 152.8, up from 146.9 a year earlier, reflecting steady industrial momentum despite global and domestic challenges. 2. Which sector contributed most to the IIP growth? The manufacturing sector was the primary driver, expanding 4.8% in September. Strong output in basic metals (12.3%), electrical equipment (28.7%), and motor vehicles (14.6%) supported the growth, underlining broad-based strength in industrial and consumer-linked production. 3. Why did growth in the core industries slow during the month? Growth in the eight core industries eased to 3% in September from 6.5% in August due to a contraction in refinery products (-3.7%), natural gas (-3.8%), and crude oil (-1.3%), which offset gains in steel (+14.1%) and cement (+5.3%). 4. How did different use-based categories perform in September 2025? Performance was mixed. Growth improved for capital goods (4.7%), intermediate goods (5.3%), infrastructure goods (10.5%), and consumer durables (10.2%). However, primary goods growth slowed to 1.4%, and consumer

Crunching the numbers: India’s snacks industry goes global
India’s snacks industry, celebrated for its remarkable diversity—from traditional namkeens and bhujias to modern chips, extruded snacks, and baked innovations—is fast emerging as a global powerhouse. Once rooted mainly in domestic consumption, the category now spans a wide range of formats and flavors, catering to both traditional and contemporary palates. Backed by India’s rich culinary heritage and a rapidly expanding processed food sector, Indian snack exports are steadily making their mark worldwide. In FY 2024–25, India’s agricultural and processed food exports touched US$ 49.4 billion, with processed foods contributing 20.4%—a sharp rise from 13.7% in earlier years. With global consumers increasingly seeking exotic, convenient, and health-oriented indulgences, Indian snacks are well-positioned to capture a growing share of the multi-billion-dollar global snacking market. Within this larger segment, ethnic snacks—such as sev, gathiya, chakli, murukku, and banana chips—remain a compelling growth driver. The Indian ethnic snacks market was valued at US$ 5.18 billion in 2024 and is projected to reach US$ 17.5 billion by 2033, growing at a robust CAGR of 14.5%. While domestic demand continues to fuel expansion, rising exports to diaspora-rich and adventurous international markets signal the growing global fascination with authentic Indian flavours. The global snacks food market is witnessing steady expansion, driven by urbanization, rising disposable incomes, and a preference for convenient, on-the-go snacking options. As illustrated in the line graph below, global imports of snacks food have climbed from US$ 67 billion in 2019 to US$ 93 billion in 2024, marking a five-year CAGR of approximately 6.8%. This upward trajectory, with a notable recovery post-2020 pandemic disruptions, highlights the sector’s resilience and the increasing appetite for diverse, ethnic-inspired products worldwide. The dip to US$ 67 billion in 2019 followed by a steady rise through 2024 underscores how consumer shifts toward healthier and fusion snacks are fueling import volumes, particularly in developed markets where e-commerce and retail channels have accelerated penetration. Key markets for snack foods The snacks food import landscape is dominated by a handful of key markets, with the top importers collectively commanding a significant portion of the global pie. The US holds the lion’s share at 13%, driven by its vast consumer base and multicultural demographics. China follows with 8%, reflecting rapid urbanization and a growing demand for convenient indulgences. Together, advanced economies across North America and Europe capture a substantial share of global imports, underscoring mature markets’ appetite for premium, innovative, and health-oriented snacks. Meanwhile, Asia’s evolving dietary preferences signal rising opportunities for ethnic and fusion varieties such as Indian namkeens and ready-to-eat products. India’s position among the world’s top snack exporters has strengthened remarkably over the past five years, transitioning from a modest player to a competitive force in the global arena. The line graph below compares India’s performance against the top five exporters—US, Germany, China, Netherlands, and Singapore—revealing India’s exports surging from US$ 0.54 billion in 2019 to US$ 1.2 billion in 2024, achieving a five-year CAGR of over 17%. This trajectory has elevated India to the 21st position globally among snack exporters, steadily closing the gap with mid-tier players like the Netherlands. The rise is driven by advances in processing and packaging technologies, as well as growing global demand for ethnic and authentic snack varieties, positioning Indian snacks as a high-growth category amid diversification from traditional suppliers. India’s export performance and potential Indian snacks have found fertile ground in select international markets, where both diaspora communities and adventurous local consumers drive demand for authentic flavors. The pie chart below highlights the top export destinations in 2024, with the US leading at 23.9% of India’s snacks exports, supported by its 4.5 million-strong Indian diaspora and growing mainstream adoption in retail chains. The UAE follows closely at 10%, benefiting from geographic proximity and strong trade ties. Canada (6.2%), Australia (5.9%), and the Netherlands (4.8%) present opportunities for growth through targeted marketing strategies. Meanwhile, rising shares in the Middle East and Southeast Asia point to pathways for broader mainstream acceptance, signaling significant potential for expanding India’s global snack footprint. Indian snacks are well poised to capitalise on emerging trends in the global market. First, the shift toward healthier options is paramount. Consumers worldwide are gravitating toward low-fat, multigrain, and baked variants, prompting Indian brands to innovate with millets, legumes, and whole grains in extruded snacks. The India healthy snacks market alone was valued at US$ 4.12 billion in 2024 and is expected to double to US$ 8.2 billion by 2033. This aligns with global wellness movements, where Indian super foods like ragi chips and quinoa-infused namkeens are gaining traction. Second, fusion flavors are bridging cultural gaps. Blends of traditional Indian spices with international tastes—such as masala-flavored tortilla chips or tandoori peri-peri puffs—are captivating younger demographics in the West. Partnerships like PepsiCo and Tata Consumer Products’ January 2025 collaboration to launch fusion ethnic snacks exemplify this trend. Sustainability and clean labeling are also rising priorities. Extrusion processes enable preservative-free products with extended shelf life, complying with stringent regulations like EU and US FDA standards. Portion-controlled, single-serve packaging further caters to on-the-go lifestyles, boosting export viability in markets like the UAE and UK. Opportunities: Untapped markets and strategic pathways The global Indian diaspora—over 32 million strong—presents a ready market for traditional snacks, but the opportunity extends well beyond ethnic consumption to mainstream adoption across Europe, the Middle East, and Southeast Asia. Key destinations include the US (the top importer), followed by the UK, Canada, Australia, and the UAE, where Indian snacks command premium pricing due to their authenticity. Emerging markets such as the Netherlands and Malaysia also offer strong growth prospects, driven by trade agreements and the rising popularity of multicultural cuisines. Product innovation remains the key gateway to global expansion. Plant-based, gluten-free, and vegan adaptations can effectively tap into the rapidly growing global snacks market. Events like Indusfood further highlight these opportunities, showcasing MSME innovations to international buyers and strengthening India’s visibility on the global stage. Meanwhile, e-commerce platforms and private labels offer low-barrier entry routes for exporters, while globally recognized certifications such as

The biodiesel equation: Palm oil, mandates and global implications
The global drive to decarbonize transportation has placed biodiesel at the center of clean-fuel strategies. It promises lower emissions and easy integration with existing engines, but rapid biodiesel expansion has triggered difficult questions around food security, land pressure, subsidies, and environmental risk. When edible oils power vehicles as well as kitchens, energy policy becomes a delicate balancing act. Indonesia’s shift toward higher palm oil–based blends, now moving from B40 to B50, is the most significant real-world test of this challenge. The program has improved energy self-sufficiency, yet has also tightened edible oil supplies, increased fiscal burdens, and amplified concerns about deforestation and climate-driven yield volatility. For India, which imports most of its edible oils while advancing its own biofuel mandate, Indonesia’s experience is both a warning and a guide. This article examines the global context, Indonesia’s approach, and the key lessons India must adopt to ensure clean energy progress does not compromise food and economic security. The rising global demand for cleaner and more sustainable fuels is accelerating the shift toward biofuels over the past few years. Broadly, biofuels are renewable fuels derived from biomass and are being increasingly adopted as a key measure to curb carbon emissions, combat climate change, and enhance energy security. They are primarily produced in two forms—ethanol and biodiesel. While ethanol is made from sugar- and starch-rich crops like cereals, biodiesel is produced mainly from oilseed crops such as palm, rapeseed, sunflower, and soybean. Biodiesel’s ability to ensure complete combustion significantly reduces greenhouse gas (GHG) emissions, making it a preferred alternative to fossil fuels. High compatibility with existing diesel engines further strengthens its appeal, while expanding vehicle ownership and industrial applications continue to drive consumption worldwide. It is gaining traction in the automotive sector for its lower emission profile. Emerging economies such as India, China, Brazil, and several EU nations have also announced targets to substitute 10–20% of fossil-based fuels in transportation with biodiesel. As nations pursue decarbonization goals, the challenge lies in advancing biodiesel growth without compromising global food security. Biodiesel production has been inextricably connected to the “food versus fuel” debate, raising concerns about global food security with the diversion of agricultural land and resources toward its production. As more cropland gets redirected for fuel production, the availability of land for food cultivation shrinks, potentially affecting food supplies and prices. With a growing global population and increasing food demand, balancing energy generation with food production has become essential. Poorly designed incentive structures for biodiesel adoption could unintentionally worsen food insecurity and contribute to price volatility in global food and edible oil markets. The global biodiesel market, valued at US$ 32.1 billion in 2021, is expected to grow at a CAGR of 10% from 2022 to 2030, reaching an estimated value of US$ 73 billion by the end of the decade. Among the various feedstocks available for biodiesel production, palm oil stands out due to its high oil yield, efficiency, and cost-effectiveness. Mature oil palm plantations can produce around 3 tons of oil per hectare annually—far exceeding the output of other major oilseeds such as soy, rapeseed, and sunflower. This high productivity is particularly valuable in a world where arable land is limited, yet the demand for renewable energy sources continues to grow. Oil palm’s biological advantages further enhance its appeal. As a perennial crop, it begins bearing fruit within 3–4 years of planting and remains productive for up to 25-30 years, providing a steady oil supply with relatively low replanting needs. Moreover, both the fruit’s mesocarp and kernel yield valuable oils, further boosting output per hectare. The dominance of palm oil in the biodiesel industry presents significant environmental challenges. While it offers a renewable fuel alternative, the cultivation of oil palm is closely linked to large-scale deforestation, biodiversity loss, and increased carbon emissions from land-use changes. The conversion of tropical forests and peatlands for plantations releases vast amounts of stored carbon—often outweighing the emission savings from biodiesel use. Additionally, peatland drainage emits carbon dioxide and methane for decades, while fertilizer application, energy-intensive processing, and methane from palm oil mill effluent further add to its carbon footprint, undermining the climate benefits it seeks to achieve. Beyond emissions, the expansion of palm oil plantations threatens vital ecosystems, endangering species such as orangutans and tigers, depleting water resources, and contaminating soil and water through chemical runoff. While sustainable practices like methane capture, organic fertilizers, and certification schemes such as Roundtable on Sustainable Palm Oil (RSPO) and Indonesian Sustainable Palm Oil (ISPO) offer pathways to reduce these impacts, ensuring genuinely sustainable palm-based biodiesel remains one of the most pressing global environmental challenges. Global production and demand To promote biodiesel production, many countries have implemented public support policies aimed at developing and sustaining biodiesel markets. This approach comes from the fact that biodiesel production costs remain higher than those of fossil fuels, despite recent improvements in efficiency. One of the most common forms of policy support is the introduction of blending or use mandates, which require a minimum share of biodiesel content in diesel—primarily in the transportation sector, though these requirements are sometimes extended to industrial and agricultural uses as well. Globally, biodiesel blending mandates vary widely. The United States blends biodiesel at around 2.5%, while Brazil maintains a B10 mandate. In the European Union, biodiesel blending is set at B7, whereas China’s biodiesel admixture remains low at about 0.2% due to limited enforcement. India keeps the target of blending at 5%. Among the leading biofuel-producing nations, Indonesia stands out for its ambitious blending targets and rapid policy-driven expansion. The country leads globally with the highest mandate at B40, with plans to raise it to B50, which was was successfully implemented by March 2025 after a technical transition period. It’s government has positioned palm oil as a central biofuel feedstock. The program has performed beyond government projections, with demand already exceeding the 2025 target of 15.6 million kiloliters and additional requests for 100,000–200,000 kiloliters expected before the end of the year. This strong domestic consumption has
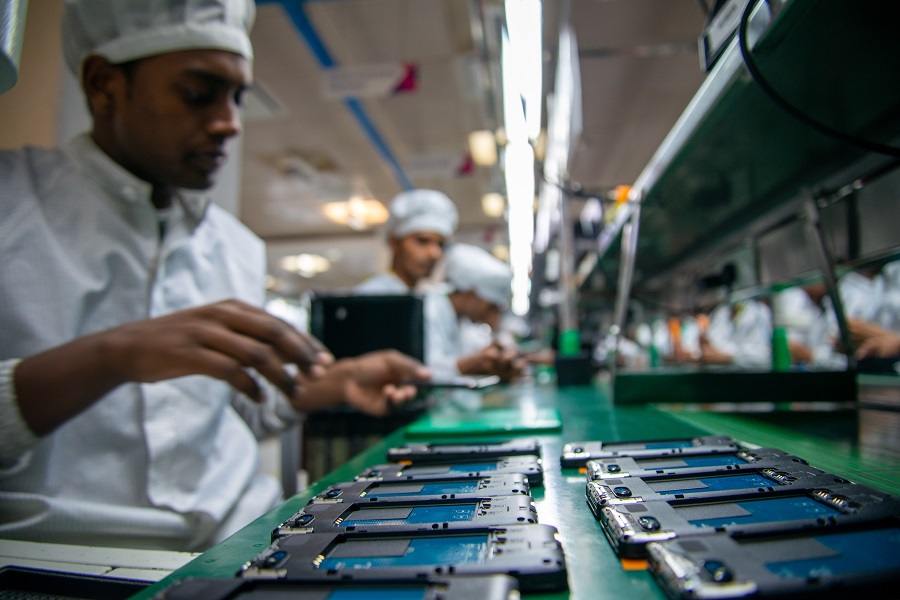
Electronics exports jumped 42% y-o-y in H1 FY26
India’s electronics exports have surged 42% year-on-year to US$22.2 billion in the first half of FY26, positioning the sector to soon overtake petroleum as India’s second-largest export after engineering goods. Driven by Apple’s US$10 billion iPhone exports and the success of the Production Linked Incentive (PLI) scheme, electronics have rapidly climbed India’s export rankings, growing 63% in three years. Once reliant on imports, India is currently the world’s second-largest mobile manufacturer, producing over 330 million devices annually. This transformation reflects India’s shift toward a high-tech, self-reliant economy and a rising global hub for electronics manufacturing. India’s electronics exports are rapidly ascending the global trade ladder and could soon overtake petroleum products as the country’s second-largest export category, after engineering goods. According to Commerce Ministry data, India’s electronics exports rose sharply by 42% year-on-year in the first half of FY26, reaching US$22.2 billion compared to US$15.6 billion a year earlier, making the segment the country’s fastest-growing among 30 export categories. Nearly half of this value — about US$10 billion — comes from Apple’s iPhone shipments, underlining the growing role of high-end smartphone manufacturing in India’s export basket. In contrast, petroleum product exports have been on a steady decline, dropping 16.4% to US$30.6 billion in the first six months of FY26 from US$36.6 billion a year earlier. Engineering goods, the top export category, grew moderately by 5.35% to US$59.3 billion from US$56.3 billion. The declining trend in petroleum exports is linked to tightening US pressure on Indian refiners to curb imports of discounted Russian crude, which previously gave Indian refiners a significant cost advantage. With this edge eroding, experts predict that petroleum exports could fall further, accelerating electronics’ rise to the second spot by FY28. The shift marks a major structural transformation in India’s export composition. Electronics, ranked seventh in FY22, climbed to fourth in FY24 and then to third in FY25, surpassing traditional leaders such as gems and jewellery, chemicals, pharmaceuticals, and readymade garments. In just three years, electronics exports have grown an impressive 63%, from US$23.5 billion in FY23 to US$38.5 billion in FY25. Analysts estimate that if the current momentum continues, India’s electronics exports could double between FY23 and FY26. The narrowing gap between petroleum and electronics exports illustrates the changing dynamics of India’s trade profile. When the government launched the production-linked incentive (PLI) scheme in 2020, the gap between the two sectors stood at nearly US$74 billion. By FY25, it had shrunk to US$24.7 billion, and experts forecast it will reduce further to around US$16 billion in FY26. Although petroleum products are likely to retain the second position for now, the trajectory suggests that electronics could surpass them within the next two to three years, provided global oil trade restrictions persist. The smartphone PLI scheme has been the primary driver of this growth. Global majors such as Apple and Samsung, along with Indian contract manufacturers like Dixon Technologies, have leveraged government incentives to expand production and exports. Apple’s growing integration into India’s manufacturing ecosystem has been particularly transformative. The company has established India as its second major global base after China for iPhone manufacturing. Made-in-India iPhones now account for over 20% of Apple’s global shipments. In the first half of FY26 alone, Apple exported iPhones worth US$10 billion, representing about 75% of total smartphone exports and 45% of all electronics exports from India. Experts note that India’s trajectory mirrors China’s earlier success in making electronics its top export category. The current geopolitical realignments, coupled with global efforts to diversify supply chains away from China, are presenting India with a historic opportunity to establish itself as a competitive global electronics hub. If sustained, this transformation could redefine India’s export structure and position electronics as a cornerstone of its external trade growth by FY28. From imports to manufacturing powerhouse India’s mobile revolution, which began on 31st July 1995 with the country’s first-ever mobile call, has evolved into a powerful story of digital empowerment and economic transformation. What started as a communication milestone has become a defining force shaping how 1.4 billion Indians connect, learn, and earn. Driven by affordable data and widespread access, India’s telecom revolution has deeply influenced everyday life, turning mobile phones into essential tools for finance, education, entertainment, and enterprise. With 85.5% of households now owning at least one smartphone, mobile connectivity has become a social and economic equaliser. In rural India, farmers rely on digital tools such as the Digital Crop Survey, Kisan Portal, and National Pest Surveillance System (NPSS) to make data-driven decisions about weather, crops, and prices. According to the Comprehensive Modular Survey: Telecom (Jan–Mar 2025), 96.8% of rural youth and 97.6% of urban youth use mobile phones for communication and internet access, underscoring their central role in everyday life. A decade ago, India was largely dependent on imported mobile phones. Today, it has emerged as the world’s second-largest mobile manufacturing hub, producing hundreds of millions of devices annually. In 2014, India had just two mobile manufacturing units; now, there are over 300. This rapid expansion has been driven by flagship government programmes like Make in India and the Production Linked Incentive (PLI) scheme, which have boosted domestic production, attracted global investors, and accelerated India’s digital transformation. The country now ranks as the third most digitalised economy in terms of overall digitalisation and twelfth among G20 nations for individual digital usage. Its digital economy is projected to grow nearly twice as fast as the overall economy, contributing one-fifth of national income by 2029–30. The electronics sector has been central to this transformation. Once a minor contributor, it now represents one of India’s fastest-growing industries, overtaking traditional export sectors like textiles and gems and jewellery. Smartphones, in particular, have driven this growth, creating over 12 lakh jobs in the past decade. Total electronics production has risen from ₹1.9 lakh crore in 2014–15 to ₹11.3 lakh crore in 2024–25, while mobile phone output has surged from ₹18,000 crore to ₹5.45 lakh crore—a 28-fold increase. The export boom and India’s global edge India’s smartphone market captures

Kerala unveils vision 2031 to boost industry and investment
With Vision 2031, the Kerala government has set its sights on turning the state into a competitive industrial powerhouse by focusing on innovation corridors, skill development, and inclusive growth. The Kerala government on Thursday unveiled Vision 2031, an ambitious blueprint aimed at positioning the state as a major industrial hub and one of India’s leading investment destinations. Industries, Law and Coir Minister P. Rajeeve said the government would introduce significant structural reforms to boost industrial growth and strengthen the state’s manufacturing sector. He noted that the new vision document lays out a detailed strategy to transform Kerala into the country’s top industrial destination through comprehensive reforms and projects. One of the major policy initiatives under consideration is an amendment to the Single Window Clearance Board Act, focusing on the establishment of industrial townships and special investment zones to simplify project approvals and promote large-scale industrialisation. To address the state’s evolving skill requirements, the government plans to set up the Kerala University for Skill Development and Entrepreneurship under a public-private partnership model. The university will aim to equip young people with skills relevant to emerging industries by integrating education, incubation, and knowledge creation. A key highlight of the document is the proposed Vizhinjam Outer Area Growth Corridor, intended to transform the region surrounding the Vizhinjam port into a global economic hub. The project includes eight industrial clusters and extends into the Vizhinjam–Kollam–Punalur Growth Triangle, spanning more than 1,700 acres. The corridor is expected to drive the development of a port-based smart industrial and economic ecosystem. The plan also envisions Kerala becoming a global technology centre through the establishment of 200 Global Capability Centres (GCCs) and dedicated innovation parks. Another flagship project, the Kochi Global City, is being developed across 358 acres as part of the Kochi–Bengaluru Industrial Corridor. Designed to attract global financial institutions and corporate headquarters, the project is projected to create around 1.2 lakh direct and 3.6 lakh indirect jobs. Rajeeve said the government remained committed to ensuring a level playing field for both large and small industries, while also promoting the inclusion of women, marginalised communities, and other underrepresented groups in the state’s industrial growth story. Kerala’s industrial landscape has expanded significantly in recent years. The number of registered enterprises has risen from 85,000 in 2021 to 1.685 million, with nearly 48% of them owned by women entrepreneurs—an indication of the state’s growing entrepreneurial participation. The government also plans to develop an aero-defence and drone industrial cluster in Thiruvananthapuram, leveraging its proximity to the Vikram Sarabhai Space Centre and ISRO. In the Malabar region, a Biotech and Life Sciences Campus along with an ESDM and Power Electronics Campus will be established as part of the Kozhikode–Malappuram Industrial Cluster, tapping into the region’s technological potential. Another key initiative, Arena Malabar (Kerala Sports Metropolis), will be developed as a multi-sectoral mega project that integrates sports, healthcare, and industry. The project will feature a comprehensive healthcare centre for athletes and facilities for manufacturing sports equipment. In northern Kerala, a Kannur–Kasaragod Industrial Corridor spread across 2,000 acres is being planned, with a focus on Fintech, IT and ITeS, artificial intelligence, robotics, handlooms, and logistics. Additionally, a mega food processing park in Kollam will focus on value addition in spices, seafood, coconut, and cashew products, further strengthening Kerala’s traditional industries. Collectively, these initiatives reflect the state’s long-term commitment to building a diversified, innovation-driven, and inclusive industrial ecosystem.