
India’s plastics industry has grown into a US$ 73 billion sector employing nearly 4 million people, but rapid consumption has led to unsustainable waste generation. Despite recycling nearly 60% of its plastic—higher than many developed economies—India’s system struggles with downcycling, mixed waste streams, and poor segregation. Drawing lessons from global best practices, India can adopt innovative solutions such as stronger enforcement of Extended Producer Responsibility (EPR), Deposit Return Schemes (DRS), “Pay-As-You-Throw” (PAYT) systems, advanced chemical recycling, and community-driven upcycling models. Plastic has become inseparable from modern life—found in everything from packaging and agriculture to household goods—making it both a driver of convenience and a source of mounting environmental concern. India’s consumption of plastics has grown rapidly in recent decades, reflecting its integration into daily routines across urban and rural landscapes. While the country still records lower per capita plastic use compared to developed economies, the sheer scale of its population has magnified the challenge. Globally, more than 8,300 million tons of plastics have been produced since the 1950s, primarily from petrochemical sources—a dependence that persists, with about 4% of fossil fuel extraction still channeled into plastic production. How big is the problem? Official estimates from the Central Pollution Control Board (CPCB) put India’s national plastic waste generation for 2019–20 at approximately 3.47 million tonnes per year. This figure (reported from state/UT responses) is widely used in national analyses and remains a useful baseline, though generation has likely changed since that survey. India’s plastics sector is also economically large. Policy and industry summaries commonly place the industry (including packaging and downstream products) in the tens of billions of dollars — figures around US$ 70–75 billion are often quoted for the broader plastics and packaging market. These estimates reflect both domestic consumption and exports and underline the sector’s importance for jobs and manufacturing. Globally, the production story is even more stark: researchers estimate that about 8.3 billion metric tonnes of plastic have been produced since the 1950s, with annual production now in the hundreds of millions of tonnes. This scale places plastics among the most pervasive man-made materials on Earth. What about recycling – is India doing well? India’s recovery story is complex. Official and research summaries often report that roughly 50–60% of plastic waste is collected or enters some form of recycling or reprocessing stream, thanks largely to India’s vast informal sector of waste pickers, aggregators, and small recyclers. This grassroots network diverts millions of tonnes of material away from landfills each year, giving India higher collection and recycling rates than many developed economies. Yet experts caution that headline figures mask important quality issues: much of the material is downcycled into lower-grade products, multilayered plastics reduce recovery value, and significant volumes still leak into the environment. At the same time, business opportunities in recycling are becoming increasingly visible. The PET bottle recycling segment alone is estimated to be a ₹3,500-crore industry, with nearly 70% of PET waste collected and about 65% recycled in registered facilities. Demand for recycled PET is rising sharply as FMCG majors pledge higher recycled content in packaging, creating a fast-growing rPET market projected to expand at a 9.3% CAGR through 2030. On the innovation front, Reliance Industries has commissioned India’s first ISCC-Plus certified circular polymers using chemical recycling, a milestone that turns plastic waste into virgin-grade polypropylene and polyethylene. Meanwhile, startups like WITHOUT by Ashaya in Pune are converting hard-to-recycle multi-layered plastics into consumer goods, showing how new technologies can open up markets once considered unviable. Why the system faces challenges? Several structural factors influence recycling efficiency in India: 1. Mixed and Contaminated Streams : Multi-layer packaging, polymer blends, and food-contaminated plastics make mechanical recycling technically challenging, often leading to downcycling. According to a report by the Comptroller and Auditor General of India (CAG), while many plastics are technically recyclable, actual recycling rates remain limited, highlighting the need for improved collection, sorting, and processing solutions. 2. Informal-Formal Sector Integration: Informal collectors recover a significant portion of plastic waste and play a vital role in resource efficiency. Aligning informal practices with formal frameworks could enhance worker safety, material traceability, and investment in recycling infrastructure. According to a report by the Centre for Science and Environment (CSE), integrating informal actors into structured programs can strengthen the overall recycling ecosystem. 3. Technological Limitations : Conventional mechanical recycling is most effective for certain types of plastics. Emerging chemical recycling technologies—such as depolymerization, pyrolysis, and solvolysis—offer promising avenues for handling mixed plastics. Scaling these solutions safely and efficiently will require continued innovation and validation, as noted in recent research published in Sustainability. 4. Policy Implementation and Coordination : India’s Extended Producer Responsibility (EPR) framework provides a strong foundation for producer involvement in waste management. Ongoing efforts focus on refining operational guidelines, enhancing monitoring, and supporting local authorities and aggregators to improve system efficiency. Strengthening coordination between stakeholders—including producers, municipalities, and waste management organizations—can accelerate progress toward a circular plastic economy. Opportunities in India’s circular plastics sector India’s growing plastic consumption and evolving waste management ecosystem present significant commercial potential. Global best practices and local success stories highlight scalable models that can deliver both environmental impact and profitable returns. 1. Extended Producer Responsibility (EPR) Structured EPR schemes can integrate informal collectors, fund collection infrastructure, and improve traceability. Businesses providing collection logistics, tracking platforms, and compliance services can become key partners for brands under EPR obligations. 2. Deposit Return Schemes (DRS) High-return systems for beverage containers, successfully implemented in countries like Germany and Norway, can be piloted in Indian metros. Investment opportunities include reverse vending machines, automated sorting, and marketplaces for recyclables, creating predictable streams of feedstock for recycling enterprises. 3. Pay-As-You-Throw (PAYT) Variable pricing models encourage waste segregation and reduce landfill volumes. Opportunities exist in digital collection systems, smart bins, and analytics services for urban wards or gated communities, generating recurring revenue while improving recycling rates. 4. Advanced Recycling Technologies Chemical recycling and other emerging methods can process mixed plastics and produce high-value outputs. For example, Reliance Industries’ Jamnagar refinery produces ISCC-Plus

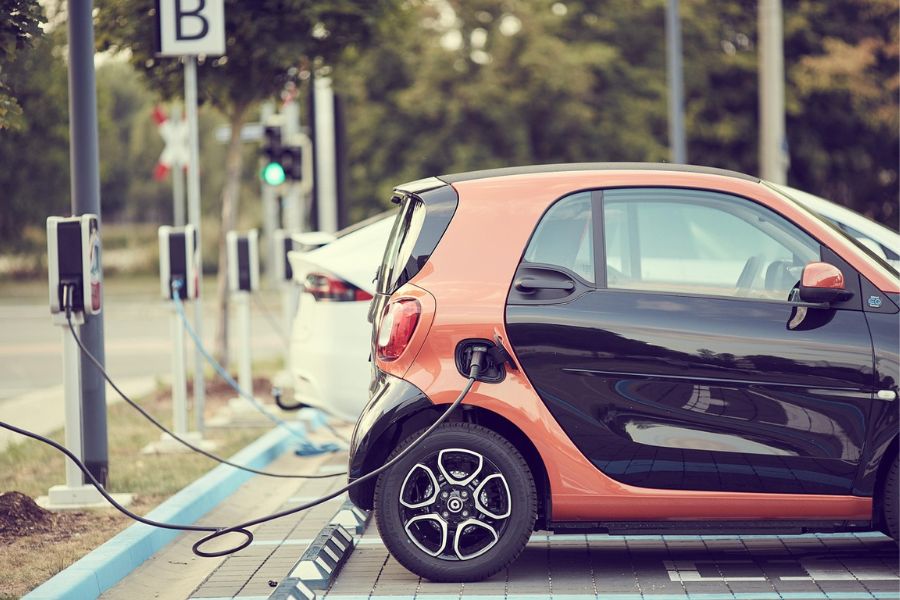
Centre issues guidelines for nationwide ₹2,000 Cr EV charging
The Ministry of Heavy Industries has released guidelines under the PM E-Drive scheme to deploy 72,300 EV charging stations nationwide, backed by ₹2,000 crore, accelerating India’s clean mobility transition and tackling infrastructure gaps. This move marks a significant step in India’s journey toward large-scale electric mobility adoption and cleaner transportation. The Ministry of Heavy Industries (MHI) has issued operational guidelines for the deployment of electric vehicle public charging stations (EV PCS) under the Prime Minister Electric Drive Revolution in Innovative Vehicle Enhancement (PM E-Drive) scheme. The move marks a significant step in India’s journey toward large-scale electric mobility adoption and cleaner transportation. With an allocation of ₹2,000 crore, the government aims to establish about 72,300 public EV charging stations across the country. This initiative will not only accelerate EV penetration but also address a critical bottleneck—limited charging infrastructure—hindering consumer adoption. A Tiered Subsidy Framework The guidelines detail a tiered subsidy structure designed to support deployment across diverse locations, ensuring both inclusivity and strategic coverage. Government premises such as ministries, offices, hospitals, residential complexes, and educational institutions will receive 100% subsidy on both upstream infrastructure and EV charging equipment (EVSE). This full subsidy is conditional upon chargers being accessible to the public at no cost. Transport hubs and public sector-controlled locations, including railway stations, airports, oil marketing company (OMC) outlets, bus depots, and toll plazas, will benefit from 80% subsidy on upstream infrastructure and 70% subsidy on EVSE costs. At other public locations like shopping malls, market complexes, and city streets, an 80% subsidy on upstream infrastructure will be available, while EVSE costs will not be subsidized. Battery swapping and charging stations, irrespective of location, will be eligible for 80% subsidy on infrastructure, acknowledging their growing role in commercial fleet electrification. This graded approach ensures that the maximum support is extended where charging facilities are likely to have the highest utilization and public impact. Benchmark Costs and Subsidy Calculation To bring uniformity and avoid inflated project costs, the government has specified benchmark cost ranges for both upstream infrastructure and EVSE. For upstream infrastructure, costs range from ₹6.04 lakh for chargers up to 50 kW to ₹24 lakh for chargers above 150 kW. For EVSE, costs vary with charger type and capacity. For example, a CCS-II charger of 50 kW costs ₹7.25 lakh, while a 100 kW CCS-II charger costs ₹11.68 lakh. These benchmarks will serve as the base for determining eligible subsidies and ensure financial prudence in deployment. Focus on Urban Centres and High-Density Corridors The PM E-Drive scheme has prioritized urban centres with populations over one million, smart cities, metro-linked satellite towns, and state capitals. Furthermore, high-density national and state highways have been earmarked for coverage to facilitate long-distance EV travel. Public transport hubs—such as airports, railway stations, and fuel retail outlets—will also see robust infrastructure development, reflecting the government’s focus on locations with maximum commuter footfall. This geographical prioritization is aligned with India’s EV growth trajectory, which has been concentrated in major cities and intercity corridors. Recognizing the importance of leading by example, the scheme also incentivizes government department fleets. Central ministries, central public sector enterprises (CPSEs), and state/UT governments, along with their PSUs and affiliated agencies, will be eligible for benefits under the scheme. This move will encourage large-scale adoption of EVs in official transport fleets, sending a strong market signal and further mainstreaming the EV ecosystem. Institutional Mechanism and Implementation The operational framework mandates nodal bodies to identify high-priority charging locations and submit consolidated proposals through a dedicated online portal. This structured process aims to avoid duplication, ensure accountability, and streamline execution. For on-ground execution, Bharat Heavy Electricals Limited (BHEL) has been appointed as the Project Implementation Agency. Its responsibilities include ensuring timely rollout, maintaining quality standards, and facilitating subsidy disbursal. The subsidy will be released in a two-tranche system, linked to compliance and performance benchmarks. This outcome-based model is designed to guarantee delivery and prevent misuse of funds. Technology Integration for Transparency In line with India’s digital governance approach, all charging stations under the PM E-Drive scheme must integrate with the National Unified EV Charging Hub. This integration will provide: Real-time station availability updates Seamless payment facilitation Usage monitoring and data analytics Such measures will enhance user convenience, enable efficient operations, and help policymakers track adoption trends for future planning. The rollout of EV charging stations under PM E-Drive is expected to create a multiplier effect on India’s electric mobility landscape. Affordable and widespread access to charging infrastructure will reduce range anxiety, encourage more consumers to adopt EVs, and help commercial fleets shift away from fossil fuels. Additionally, the scheme will stimulate local manufacturing of EV chargers and allied components, create green jobs, and contribute to India’s climate commitments under COP28 and its net-zero 2070 vision. By combining financial incentives, institutional mechanisms, and digital integration, the government is laying the foundation for a future-ready charging ecosystem. With 72,300 EV PCS planned nationwide, the PM E-Drive scheme is poised to be a game-changer in India’s transition to sustainable, clean, and inclusive mobility.
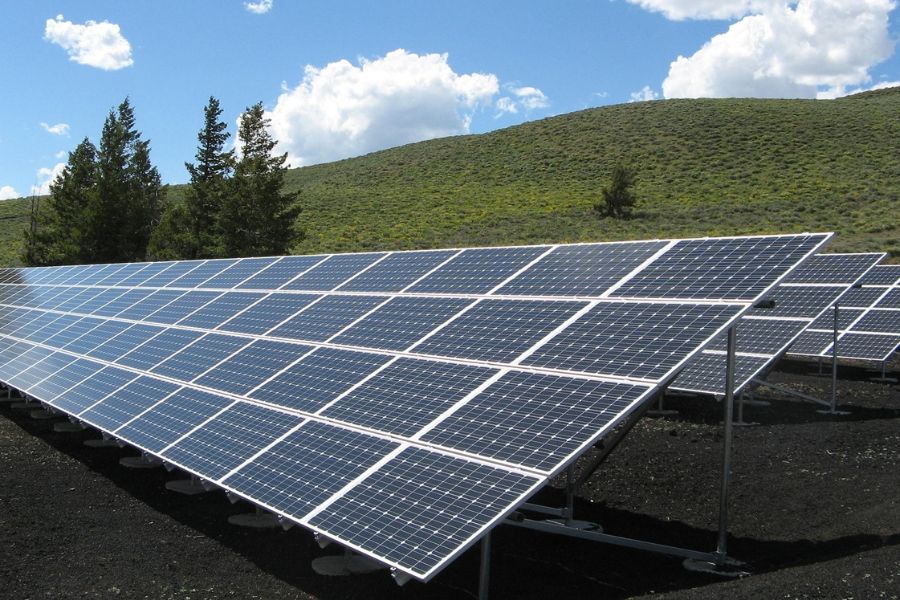
India’s solar potential soars: NISE maps 3,343 GWp from wastelands
India has enough sunlight to power its future many times over. A new study by the National Institute of Solar Energy (NISE) estimates that the country can generate 3,343 GWp of solar power from just 27,571 sq km of wasteland — more than eight times its current installed capacity. With Rajasthan, Maharashtra, Andhra Pradesh, and Gujarat leading the way, this report highlights how solar potential extends far beyond deserts, unlocking new opportunities for jobs, investment, and India’s clean energy transition. India’s dream of becoming a renewable energy powerhouse just received a big boost. A new study by the National Institute of Solar Energy (NISE) has revealed that the country has the potential to generate over 3,343 gigawatts (GWp) of electricity through ground-mounted solar projects. What’s more striking is that this potential can be harnessed using only a fraction of the country’s wasteland — about 27,571 square kilometres, or less than 7% of total wasteland available. This fresh estimate is a sharp rise from NISE’s earlier 2014 assessment, which had pegged the potential at about 749 GWp. The jump reflects advances in solar technology, better geospatial mapping, and a more refined understanding of land and resource use. NISE, an autonomous institute under the Ministry of New and Renewable Energy (MNRE), carried out a detailed analysis using advanced geospatial datasets. Unlike the earlier study, which relied heavily on broad assumptions, the new report factors in crucial development constraints. These include: Terrain (slope and aspect of land) Land use and sustainability concerns Solar irradiance (amount of sunlight received) Proximity to roads and electricity substations By applying these filters, the study ensures that the identified potential is both feasible and practical, not just theoretical. Importantly, it also capped solar deployment at no more than 10% of wasteland in any given state, ensuring sustainable land use. The numbers: Where the potential lies The report reveals that Western India alone accounts for nearly half (45%) of the total potential. The region benefits from vast stretches of barren land and some of the highest solar radiation in the country. Here are the leading states with the highest feasible capacity: Rajasthan – 828.78 GWp Maharashtra – 486.68 GWp Madhya Pradesh – 318.97 GWp Andhra Pradesh – 299.31 GWp Gujarat – 243.22 GWp Southern states also contribute significantly. Andhra Pradesh, Karnataka (223.28 GWp), Tamil Nadu (204.77 GWp), and Telangana (140.45 GWp) together add up a large share despite having less wasteland than Rajasthan or Maharashtra. Their strength lies in favourable solar geometry, high irradiation levels, and efficient land use. On the other hand, Northeastern and Himalayan states such as Nagaland, Mizoram, Arunachal Pradesh, and Uttarakhand have much lower potential due to rugged terrain, dense forests, and scattered wastelands that are harder to access. India has come a long way in solar adoption. Back in 2014, the country had just 2.82 GW of installed solar capacity. Fast forward to January 2025, and solar installations have crossed the 100 GW milestone. This transformation has been driven by falling solar panel costs, rising efficiencies, supportive policies, and a growing domestic manufacturing base. Today, India has built over 100 GW of annual solar PV module manufacturing capacity and nearly 20 GW per year in wind turbine capacity, with about 80% of the wind sector now indigenised. One of the most important insights from the NISE study is that solar potential is not limited to deserts like Rajasthan and Gujarat. States such as Maharashtra, Andhra Pradesh, Karnataka, and Tamil Nadu also have massive untapped potential. For example, Maharashtra alone has the capacity to add nearly 487 GWp, while Andhra Pradesh can add 299 GWp. This diversification means that India’s solar growth can be spread across regions, bringing economic opportunities, jobs, and investment to multiple states. What this means for India’s energy future To put things in perspective, India’s entire installed power capacity from all sources combined is far less than the 3,343 GWp solar potential identified in this report. In other words, the sunlight falling on India’s wastelands could generate over eight times the country’s current power capacity. This aligns well with India’s commitment to achieve 500 GW of non-fossil fuel capacity by 2030. With 100 GW of solar already installed and new opportunities identified, the country is well on track to scale up its renewable ambitions. The minister for renewable energy, while commenting on the report, highlighted that improved technology and reduced costs are game changers. Unlike the earlier methodology, which assumed just 3% of wasteland could be used, the new study leverages real-world data and acknowledges the rapid advances in photovoltaic efficiency. The road ahead The findings open doors for both policymakers and investors. With clear mapping of where solar projects can be most effective, states can now plan targeted policies and infrastructure support. It also underlines the importance of continuing to build a robust domestic solar industry, capable of meeting large-scale demand without relying on imports. At the same time, the report stresses the need for balanced land use. Solar expansion must respect ecological and social factors, ensuring that renewable energy growth goes hand in hand with sustainable development. Read more: From waste to watts: Why bio-energy could spark the next energy revolution in India India’s strategic bet on alternative battery technologies and energy security FAQs: What is India’s total solar energy potential according to the latest NISE report?India has an estimated 3,343 GWp of ground-mounted solar potential, mapped from 27,571 sq km of wasteland across the country. Which state in India has the highest solar energy potential?Rajasthan tops the list with 828 GWp, followed by Maharashtra (486 GWp), Madhya Pradesh (318 GWp), Andhra Pradesh (299 GWp), and Gujarat (243 GWp). How much solar capacity has India installed so far?As of January 2025, India has crossed 100 GW of installed solar capacity, up from just 2.8 GW in 2014. How does India’s solar potential compare to its renewable energy targets?The 3,343 GWp potential is more than 8 times India’s current total power capacity and a strong base to achieve the

e-NAM 2.0: India’s leap towards digital agriculture
The government will soon roll out e-NAM 2.0 to strengthen digital agricultural trade by enabling automated bidding, demand-supply data, QR-based tracking, and private services like assaying and logistics. Designed to handle higher transaction volumes, it aims to reduce wastage, minimize intermediaries, and improve farmer incomes. Since its 2016 launch, e-NAM has connected 1,522 mandis across 23 states and 4 UTs, covering 231 commodities and registering nearly 18 million farmers. Trade value rose 22% in 2024-25, though inter-state trade remains low. The government is set to introduce an upgraded version of the electronic National Agriculture Market (e-NAM) to enhance inter-state and inter-mandi trading through the platform. The upgraded platform, e-NAM 2.0, will introduce advanced features such as automated bidding, facility for demand-supply data and open network of digital commerce-linked services including assaying, logistics, and fintech support. Unlike the existing system, which lacks facilities to connect private providers of assaying and transportation at physical mandis, the new version will allow such services, thereby improving efficiency and enabling seamless interstate trade of crops, fruits, and vegetables. Officials have emphasized that e-NAM 2.0 is expected to minimize food wastage and enhance farmers’ price realization by reducing the role of intermediaries. The revamped platform is being designed to handle a much higher volume of commodity transactions to ensure smooth functioning during peak procurement periods. Sources indicated that the new system could be launched within the next few months. Expanding mandi integration and trade Since its inception in April 2016, agricultural commodities worth Rs 4.41 lakh crore have been traded on e-NAM. However, inter-state trade has remained negligible, amounting to only Rs 76.8 crore to date. In FY 2024-25, the overall turnover on e-NAM rose marginally by 2% to Rs 80,262 crore, while inter-state transactions stood at just Rs 21 crore. Inter-mandi trade since inception has been about Rs 6,230 crore. Sources indicate that, even after nine years, inter-state and inter-mandi trade on the e-NAM platform remains limited, with the majority of transactions taking place within wholesale markets. As of now, e-NAM has registered nearly- 17.94 million farmers, 4,557 Farmer Producer Organizations (FPOs), 269,688 traders, and 117,590 commission agents. Despite this wide user base, the dominance of localized transactions underscores the need for reforms. The government’s primary objective with e-NAM 2.0 is to- facilitate seamless intra-state and inter-state trade in agricultural commodities, addressing logistical gaps to enable faster trade, minimize wastage, and enhance farmer incomes. The platform will feature QR-based lot tracking and provide timely notifications to stakeholders. As of 30th June 2025, the e-NAM platform digitally integrates 1,522 wholesale mandis across 27 states and union territories. These include significant coverage in states such as Tamil Nadu, Rajasthan, Gujarat, Maharashtra and Uttar Pradesh. State Wholesale mandis Tamil Nadu 213 Rajasthan 173 Uttar Pradesh 162 Gujarat 144 Maharashtra 133 Haryana 108 Table: States with the highest number of mandis on e-NAM platform Despite the coverage, the potential remains vast as India has an estimated 7,000 mandis. Integration of additional mandis depends on recommendations from respective state mandi boards. The platform has also facilitated pioneering interstate transactions. In FY 2022-23, e-NAM enabled the first-ever inter-state trade of apples from Jammu and Kashmir to Jharkhand. Currently, 231 agricultural, horticultural, and other commodities approved by respective state governments are finalized for online e-auction on the e-NAM platform. With e-NAM 2.0, the government hopes to unlock the platform’s full potential, strengthening agricultural marketing, reducing wastage, and expanding market access for farmers nationwide. Transforming agricultural trade through e-nam and price support scheme Agricultural marketing in India is primarily governed by states, which have set up Agriculture Produce Market Committees (APMCs) to cater to local needs and support farmers, especially small and marginal ones. To reduce the dominance of middlemen and ensure farmers get fair prices, the Government of India launched the National Agriculture Market (e-NAM) in 2016. This digital platform has expanded market access, improved price discovery, lowered transaction costs, access to wider markets, reduced dependence on local mandis, and enhanced income opportunities for rural farmers. The platform has also enhanced transparency and efficiency while promoting financial inclusion by enabling online payments and minimizing cash transactions. Between June 2024 and June 2025, trade volume on the platform rose by 21%, while trade value increased by 22%, reflecting its growing role in agricultural marketing. Alongside e-NAM, the government supports farmers through Minimum Support Prices (MSPs) for 22 mandated crops, fixed annually on the recommendations of the Commission for Agricultural Costs & Prices (CACP) after consultations with states and relevant ministries. Since 2018-19, MSPs have been fixed to ensure farmers earn at least 50% returns over the all-India weighted average cost of production. Additionally, the Pradhan Mantri Annadata Aay SanraksHan Abhiyan (PM-AASHA) supports farmers by implementing the Price Support System (PSS) and Price Deficiency Payment System (PDPS) to ensure fair and remunerative prices. In conclusion, e-NAM 2.0 marks a significant advancement in India’s agricultural marketing, promoting seamless inter-state trade, reducing intermediaries, and improving price discovery. With features like automated bidding, real-time demand-supply data, and QR-based tracking, it enhances efficiency and transparency. Combined with MSP and PM-AASHA schemes, the platform ensures fair prices, boosts farmer incomes, minimizes wastage, and strengthens financial inclusion, supporting millions of farmers and transforming the country’s agricultural ecosystem. Read more Centre adds 7 new products on eNAM platform First eNAM trade between J&K, Maharashtra rolls out India Pushes for Inter State Agri Trade Through e-NAM Platform FAQs 1. What is e-NAM? The National Agriculture Market (e-NAM) is a pan-India online trading platform launched in 2016 to integrate agricultural markets, enable transparent price discovery, and provide farmers with wider access to buyers across states. 2. What is new in e-NAM 2.0? e-NAM 2.0 introduces automated bidding, real-time demand-supply data, QR-based lot tracking, and integration with private services like assaying, logistics, and fintech. These features are designed to boost inter-state and inter-mandi trade. 3. How will e-NAM 2.0 benefit farmers? The upgraded platform aims to reduce wastage, minimise intermediaries, improve price realization, and provide farmers better access to national markets with
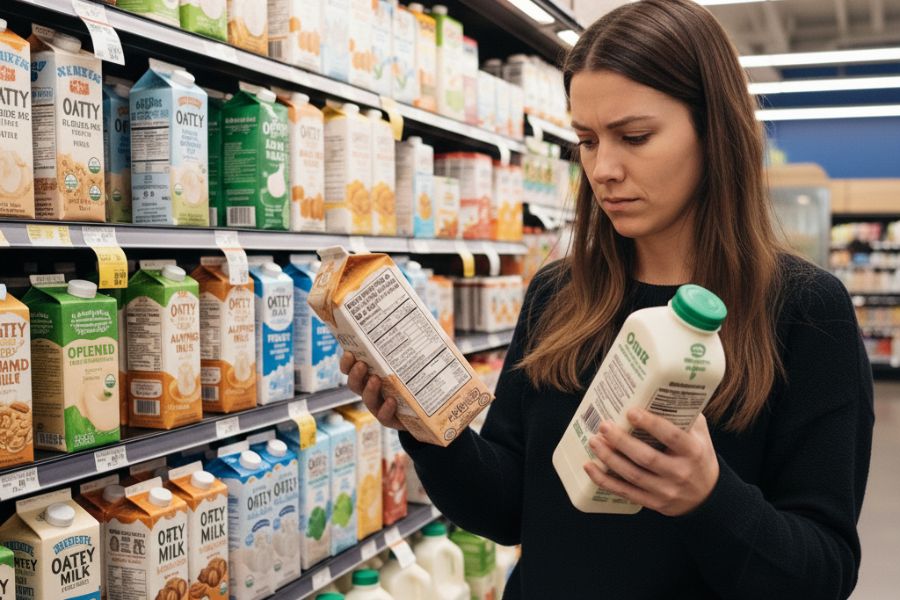
The label revolution: How FoPNL could transform diets, dairy, and trade
The Supreme Court’s recent directive mandating Front-of-Pack Nutrition Labels (FoPNL) marks a decisive step in India’s fight against rising lifestyle-related diseases. By requiring food manufacturers to provide clear, visible markers like star ratings and nutrient warnings, the verdict aims to empower consumers with quick, reliable information on packaged foods. Aligned with global best practices, this move seeks to address obesity, diabetes, and heart-related health challenges. However, its impact on India’s dairy sector, food companies, and trade dynamics makes implementation both complex and transformative. In a significant move toward promoting healthier dietary habits, the Supreme Court of India has directed the Food Safety and Standards Authority of India (FSSAI) to implement Front-of-Pack Nutrition Labels (FoPNL) on packaged food products without further delay. The directive comes amid growing concerns over India’s obesity crisis and the rising consumption of unhealthy, processed foods. This landmark move aims to empower consumers to make healthier dietary choices and tackle the rising incidence of lifestyle-related diseases like diabetes, hypertension, and heart conditions. By October 2025, packaged foods could carry two key markers: the Indian Nutrition Rating (INR), a star-based score, and Front-of-Pack Nutrition Warning Labels (FoPNL). The move follows a Supreme Court directive, which asked the Centre to finalise food safety norms within three months after a PIL was filed by NGOs 3S and Our Health. Several developed countries have adopted Front Of Package Nutrition Labeling (FOPNL) systems, which empower consumers to make healthy choices and prompt food manufacturers and retailers to offer healthier foods. The supreme court verdict: What’s new? FOPNL aims to quickly give consumers key information about the healthfulness of foods in a format that is simple and easy to understand. These systems typically use interpretive aids like symbols, colors, or letter grades to communicate a food’s nutritional content. Some countries have mandatory FOPNL policies that require all qualifying foods to be appropriately labeled, while others have voluntary government-endorsed FOPNL systems that allow manufacturers to opt in. It is designed to provide consumers with quick, clear information to help them make informed choices at the point of purchase. The government had fixed July 1, 2025, giving a strict three-month deadline from April 2025 for the central government and FSSAI to finalize and enforce these labelling norms. The FSSAI’s Draft Amendments The FSSAI’s draft amendments, published in early 2025, emphasize: Bold and enlarged font sizes for per-serve percentage contributions of added sugar, saturated fat, and sodium relative to RDA on the front panel. A mandatory logo for all milk and milk products, with size specifications based on packaging dimensions. Clear, capitalized declarations for coffee-chicory mixtures on the front panel within a rectangular box. Why It Matters: Health & Transparency There is extensive scientific evidence demonstrating that FOPNL systems can improve consumer understanding, encourage healthier diets, and even improve the quality of the national food supply. The FoPNL system enables consumers to gather information such as: Nutrient warnings – flagging foods high in sodium, sugar, or saturated fat. Traffic light labels – assigning colors (red, yellow, or green) to nutrient levels. NutriScore – assigning foods a letter grade (A–E) based on nutrient composition. Health warnings – alerting consumers to risks of overconsumption. Evidence from Chile highlights the success of such policies: daily per capita purchases of sugar, calories, saturated fat, and sodium dropped significantly after mandatory labels were introduced, while the proportion of unhealthy packaged foods in the market also declined. Impact of FoPNL on dairy Recently, some dairy products like ghee, paneer, and milk have come under scrutiny for quality and purity. Large-scale testing in Punjab revealed adulteration in paneer and ghee samples, raising health concerns. Although the Indian Dairy Association (IDA) welcomes the Supreme Court’s directive, it emphasizes that dairy products require nuanced treatment. Milk and its derivatives naturally contain fat, lactose, and sodium — nutrients that could be unfairly flagged under a uniform warning system. Labelling without context risks misrepresenting dairy’s nutritional value and discouraging its consumption, despite it being a major source of protein, calcium, and micronutrients in Indian diets. The IDA has urged regulators to adopt a balanced approach and include wider stakeholder consultation, particularly farmer-led cooperatives, MSMEs, and large corporates, to ensure fair and practical implementation. While addressing the panel on the IDA webinar on “Front-of-Pack Nutrition Labelling (FOPNL) – Implications for Milk and Milk Products”, Dr. Rupinder Singh Sodhi, President, IDA said – “The government introduced the Health Star Rating to expose junk foods loaded with unhealthy ingredients and exaggerated claims, as consumer bodies and NGOs demanded transparency. But unless regulators ensure accuracy, its credibility will be questioned. If such ratings suggest a carbonated drink is healthier than flavored milk, no consumer will trust them. For centuries, natural foods and milk products have been seen as healthy—misleading ratings risk turning this initiative itself into junk.” Possible Effects of FOPNL Milk & Dairy Products in India Some dairy products may look “less healthy,” reducing impulse purchases of flavored milk, shakes, or yogurts. Labels focusing only on “nutrients to limit” could discourage consumption of naturally nutrient-dense dairy like whole milk and paneer. Packaged dairy manufacturers may reformulate products — lowering added sugars, reducing fat content, or changing portion sizes. Packaging redesigns will create compliance costs, especially challenging for smaller cooperatives and local players. Indian Companies Companies will need to invest in nutrition testing and lab analyses to validate nutrient levels (sugar, saturated fat, sodium) as per the nutrient profile model. This includes periodic re-testing to maintain compliance. Packaging redesign costs will emerge: new label artwork, printing changes, inventory write-offs for old packaging, and regulatory approval for label proofs. Reformulation costs: R&D to reduce sugars, fats or sodium; sourcing alternative ingredients; pilot production batches; stability testing. Ongoing monitoring, auditing, and quality assurance systems will need upgrades to ensure labels match real product composition. Smaller players may lack technical infrastructure or expertise to carry out these changes, increasing reliance on external service providers or outsourcing. Global Trade & Exports Indian exporters to developed markets (which already enforce or expect clear nutrition labeling)
India’s food processing sector achieves Rs 2 lakh crore GVA
India’s food processing sector has emerged as a vital component of the country’s economy, bridging agriculture and manufacturing while driving exports and employment. With a vast agricultural base, the sector transforms raw produce into value-added products, contributing significantly to Gross Value Added (GVA) and foreign exchange earnings. Recent data indicates robust growth, with the sector achieving GVA exceeding Rs 2 lakh crore in the past two fiscal years. This article explores the sector’s performance, export trends, key markets, and future outlook, drawing on official statistics and industry reports. The food processing sector’s success is deeply intertwined with India’s agricultural productivity. With over 50% of the workforce engaged in agriculture, the sector provides a steady supply of raw materials like grains, fruits, and vegetables. Initiatives such as the Pradhan Mantri Kisan Sampada Yojana (PMKSY) have enhanced farm-to-factory linkages, reducing wastage—estimated at 20% for perishables—and adding value through processing. In 2020-21, the sector contributed 11.57% to agriculture GVA, a figure that has stabilized at 8.39% by 2024, reflecting its role in stabilizing farmer incomes. As climate-resilient farming practices expand, the sector is poised to process a wider variety of crops, further strengthening this symbiotic relationship. Gross Value Added and domestic growth The food processing industry has shown remarkable resilience and expansion. According to the Ministry of Food Processing Industries (MoFPI), the GVA for 2023-24 stood at Rs 2.24 lakh crore, marking a 7.55% increase from Rs 2.08 lakh crore in 2022-23. This follows a recovery from negative growth in 2020-21 due to the pandemic. Over the 2015-2022 period, the sector averaged an annual growth rate of 7.3%. In broader terms, the sector contributed approximately 8.80% to manufacturing GVA and 8.39% to agriculture GVA as of 2024. Earlier, in 2020-21, these shares were 10.54% and 11.57%, respectively. The PHD Chamber of Commerce and Industry (PHDCCI) estimates the market size at Rs 2,641,121 crore (US$ 307 billion) in 2023, projected to more than double to Rs 6,022,100 crore (US$ 700 billion) by 2030, fueled by rising demand for ready-to-eat and convenience foods. Government initiatives like the Pradhan Mantri Kisan Sampada Yojana (PMKSY) and Production Linked Incentive (PLI) schemes have bolstered infrastructure, with over 40 mega food parks and numerous cold chain projects operational. Foreign Direct Investment (FDI) in the sector reached US$ 11.79 billion between April 2000 and March 2024, reflecting global confidence Export performance and trends Exports of agricultural and processed food products have been a key growth driver. In 2024-25, agro-food exports reached US$ 49.43 billion, a US$ 3 billion increase from 2023-24, though slightly below the US$ 51.06 billion in 2022-23. The share of processed foods in agri-exports has surged from 13.7% in 2014-15 to 23.4% in 2023-24, indicating a shift toward higher-value products. Focusing on processed food exports specifically, data from the Agricultural and Processed Food Products Export Development Authority (APEDA) shows exports at US$ 7.70 billion in 2023-24. The trend over recent years highlights fluctuations amid global challenges like supply chain disruptions and geopolitical tensions. The following graph illustrates India’s exports of processed food (in US$ billion). This data reflects a Compound Annual Growth Rate (CAGR) of 9.9% from 2019 to 2024, despite a dip post-2022 due to factors like rising input costs and export restrictions on certain commodities. The peak in 2022 coincided with post-pandemic demand recovery, while the subsequent decline underscores the need for diversification. Overall agri-exports stood at US$ 48 billion in FY24, with processed foods contributing significantly. Key export markets India’s processed food exports are diversified across regions, with North America, the Middle East, and Africa being prominent. The United States remains the largest market, accounting for 17.5% of exports, followed by the United Arab Emirates at 7.1%. Other notable destinations include Libya (3.9%), Sudan (3.7%), Somalia (3.4%), Tanzania (3.2%), the United Kingdom (3.0%). This distribution is visualized in the pie chart, highlighting the US’s dominance due to demand for ethnic and ready-to-eat Indian foods. The Middle East and Africa markets are driven by staples like processed grains and spices. Emerging markets like Vietnam and Saudi Arabia are also gaining traction, with cereals and fruits leading exports. In 2023-24, top products included basmati rice, buffalo meat, and spices, with the US, Vietnam, and Canada as leading importers of processed items. Challenges and future prospects Despite progress, challenges persist, including inadequate cold chain infrastructure, high wastage (up to 20% for perishables), and regulatory hurdles. Food safety standards and sustainability concerns are critical, with the sector aiming to align with global best practices. Looking ahead, the industry is poised for exponential growth. Projections indicate a market expansion to US$ 700 billion by 2030, supported by urbanization, rising incomes, and e-commerce. Government targets include doubling exports to US$ 100 billion by 2030, emphasizing value addition and innovation. Investments in R&D, sustainable packaging, and digital supply chains will be pivotal. Conclusion India’s food processing sector exemplifies the nation’s potential to leverage its agricultural strengths for economic advancement. With consistent GVA growth, resilient exports, and strategic market penetration, the industry is set to play a larger role globally. By addressing infrastructural gaps and embracing technology, India can solidify its position as a food processing powerhouse, benefiting farmers, consumers, and the economy alike. Read More: From Local to Global: Empowering India’s Food Processing Sector Unlocking opportunities: Andhra Pradesh’s food processing advantage From setback to springboard: India’s shrimp export opportunity FAQ: What is food processing industry in India?The food processing industry in India involves converting raw agricultural produce—like grains, fruits, vegetables, and meat—into value-added products such as packaged foods, ready-to-eat meals, beverages, and frozen foods. What is the current size of India’s food processing industry?The market size was valued at Rs 2,641,121 crore (US$ 307 billion) in 2023 and is projected to grow to US$ 700 billion by 2030. What are the major export markets for India’s processed food products?The United States, United Arab Emirates, Libya, Sudan, Somalia, Tanzania, and the United Kingdom are among the largest markets. Which products dominate India’s processed food exports?Top exports include basmati rice, buffalo meat, spices,
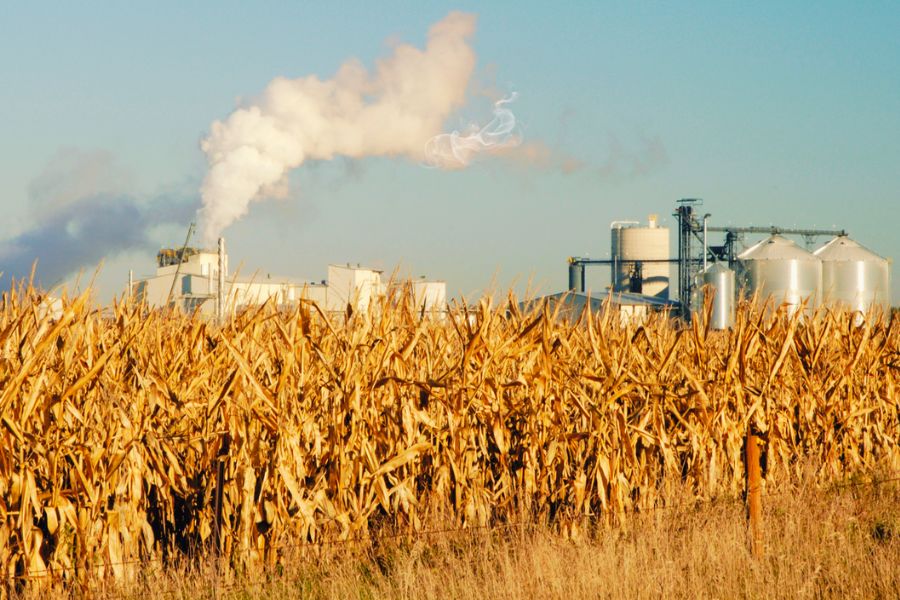
New ethanol economy: What’s next for India’s sugar mills?
Sugarcane harvests bring energy and income to millions across Uttar Pradesh, Maharashtra, Karnataka and Tamil Nadu. Yet behind the busy season lies a sector under stress: mills face rising costs, mounting arrears, and growing competition from grain-based ethanol. India’s push for cleaner fuels has opened new opportunities — but also new challenges for sugar, which is deeply tied to rural livelihoods. The way forward, experts say, lies not in a clash between feedstocks but in reimagining mills as bio-refineries that can sustain both farmers and the energy transition. In states such as Uttar Pradesh, Maharashtra, Karnataka and Tamil Nadu, sugarcane harvest season sets the local economic rhythm. India produced roughly 45.3 million tonnes of sugarcane in 2023–24, according to the Agriculture Ministry’s annual report; trade estimates put 2024–25 production slightly lower. Farmers cut the stalks, tractors ferry the cane to mills, and local markets register a spike in wages, purchases and transport — all centred on mills that turn cane into sugar, molasses and power. That tight link between crop and community is where the sector’s strain is most immediately felt. Despite a government push for ethanol blending, which aims to reduce crude imports and create steady demand for agricultural feedstocks, sugar mills are under heavy financial pressure — roughly ₹40,000 crore, per an Economic Times assessment. Those macro losses translate into delayed payments to farmers, squeezed cashflows for cooperatives, and postponed investments in modernisation. Ethanol blending was meant to give mills a reliable secondary revenue stream. In practice the picture is more mixed. State-mandated cane prices and rising input costs have kept mills’ production costs high; ethanol procurement and pricing have not always covered these gaps. At the same time, the ethanol pool has shifted: grain feedstocks such as maize and broken or damaged rice have grown rapidly as inputs for fuel ethanol. Reporting indicates that in 2024–25 grain-based ethanol made up a larger share (reported regionally at roughly 650 crore litres) while sugar-based ethanol was closer to 250 crore litres in some calculations, a shift industry bodies have highlighted as material to mill economics. The consequences are tangible. Smallholders waiting on mill payments see household budgets and farm plans upended — in Andhra Pradesh, for example, farms are reported to be owed ₹32 crore after factory closures, while a single unit needs an estimated ₹60 crore to restart operations. In Maharashtra, production fell sharply this season (reported down 29 lakh tonnes, from about 110 lakh tonnes to 81 lakh tonnes), worsening local revenue shortfalls. These local shocks compound the national picture and underline why policymakers and industry leaders now emphasise balanced, pragmatic solutions rather than looking for blame. Looking ahead, independent analyses and S&P Global reporting suggest grain-based ethanol supply could more than double in the near term — a development that improves energy security but also changes competitive dynamics for mills that built their ethanol strategies around sugarcane. The policy challenge is therefore to support diversification and bio-refinery investments while ensuring fair access and predictable pricing for mills and farmers alike Practical paths for mills and communities 1.) Diversification into bio-refinery models: Mills can evolve from seasonal sugar factories into year-round bio-refineries. That means producing ethanol, generating power from bagasse, making compressed biogas (CBG) from press mud and residues, and even moving into green chemicals and bioplastics. Multiple income streams reduce exposure to sugar price swings. 2.) Value-added sugars and niche products: Premium products — organic, low-glycemic or specialty sugars, jaggery powders — command better margins in domestic and export markets. Processing and branding these products can add value right at source. 3.) 2G and residue-based fuels: Second-generation ethanol from cane trash and agricultural residues avoids food-versus-fuel debates and makes better use of the crop’s full biomass. Investment and policy support for 2G technology would enable mills to tap abundant feedstock that currently goes uncollected or is burned. 4.) Bagasse and cogeneration: Modern, efficient cogeneration units using bagasse can make mills energy exporters — selling surplus power to the local grid and creating a steady revenue stream independent of sugar prices. 5.) Farmer-centric supply chains: Strengthened farmer aggregation (through FPOs), transparent pricing mechanisms, advance payment systems and seasonal credit lines would stabilise incomes and encourage smallholders to participate in diversified cropping systems and residue collection. 6.) Balanced feedstock policy: A calibrated, predictable approach to feedstock allocation — where sugar- and grain-based ethanol both have defined windows and procurement mechanisms — can prevent sudden market shocks. Industry bodies have proposed balanced ratios to ensure sugar mills are not crowded out. Policymakers can help by ensuring ethanol pricing reflects true production costs across feedstocks, offering bridge financing or viability gap support for mills investing in bio-refinery upgrades, and creating incentives for 2G technology adoption. Aligning cane pricing mechanisms with ethanol incentives so that when mills produce fuel, some of the price risk shifts away from them would also help. Importantly, export opportunities for specialty sugar and ethanol should be facilitated when domestic surpluses threaten local margins. Plan ahead The millions tied directly and indirectly to sugarcane depend on a system that turns planted stalks into stable income. If the mills modernise and diversify, they can become engines of rural resilience: employers, buyers of residue, and anchors for agritech and logistics services. If the sector remains locked into a single-product mindset, the next monsoon, the next swing in global sugar prices, or the next policy shift could deepen distress. India’s ethanol push was the right call for energy security and rural opportunity. The next step must be pragmatic adaptation — policy that balances feedstocks and rewards investment, and industry that embraces the bio-refinery future. That is how sugar-growing regions can convert not just cane, but also the social and economic energy of their communities, into a sustainable and dignified future. Read more: From waste to watts: Why bio-energy could spark the next energy revolution in India How biofuels are strengthening India’s energy backbone FAQs 1. Why is India’s sugar industry under financial stress despite the ethanol push?According to Economic

From niche to notable: India’s brown rice export surge
India’s brown rice sector has emerged as a key player in the global brown rice market with a 4-year export CAGR of over 100%, transitioning from a niche producer to a significant exporter amid rising demand for nutrient-rich whole grains. Bolstered by health-conscious consumers worldwide and supportive agricultural policies, India has capitalized on its vast rice cultivation base to expand exports, particularly to Asia and Africa. With shipments growing steadily over the past five years, value-added processing and sustainable farming are propelling India’s agri-exports in health-focused categories. This article explores the dynamics of the brown rice market, with a spotlight on India’s rising global footprint. The global brown rice market, encompassing unpolished whole grains valued for their high fiber, vitamins, and minerals, is witnessing robust expansion driven by health trends, urbanization, and the shift toward functional foods. The market was valued at US$ 10.60 billion in 2023 and is projected to reach US$ 15.99 billion by 2032, growing at a CAGR of 4.69% during 2024-2032. . This surge is fueled by rising awareness of brown rice’s benefits, including improved gut health, diabetes management, and weight control, with the grain increasingly recognized as a nutrient-rich food with preventive effects against cardiovascular diseases, obesity, and cancer. Global import trends of brown rice Global imports of brown rice have shown consistent growth, reflecting heightened consumption in retail, food service, and health-oriented diets. From 1.8 billion in 2019, imports climbed steadily to 2.4 billion in 2024, achieving a five-year CAGR of 6.1%. This upward trajectory underscores the market’s resilience, even amid supply chain disruptions, with demand recovering strongly post-pandemic due to a preference for whole grains over refined alternatives. Data illustrates a gradual rise, with imports dipping slightly in 2020 before accelerating through 2024. This trend aligns with broader rice trade forecasts from the USDA, which projects global rice trade at a near-record 54,1 million tons in 2024, though brown rice represents a premium, health-driven segment. Key drivers include urbanization in emerging markets and the popularity of plant-based and gluten-free diets, boosting imports in regions like Europe and North America. The top importers accounted for a substantial portion of global brown rice trade in 2024, with diverse demand from health-focused economies. South Korea leads with a 26.4% share, driven by its emphasis on nutritious staples and rising wellness trends. The United Kingdom follows at 14.2%, supported by a strong snacking culture and e-commerce penetration, while Belgium holds 14.0%, benefiting from its role as a European trade hub. Regionally, Asia-Pacific dominates due to traditional consumption, while Europe is emerging as the fastest-growing market, fueled by organic and specialty rice demand. North America, led by the U.S., sees imports rising with awareness of prebiotic benefits, projecting a market value of US$ 4.07 billion by 2032. India’s export transformation India has emerged as one of the major exporters of brown rice, leveraging its status as the world’s largest rice producer to focus on premium varieties. Exports have surged from 11 thousand tonnes in 2020 to 182 thousand tonnes in 2024, marking one of the steepest growth trajectories among major exporters. India’s brown rice exports have grown from US$ 11 million in 2020 to US$ 182 million in 2024, at a 4-year CAGR of around 102%. In value terms, they have grown from US$ 11 million in 2020 to US$ 182 million in 2024, at a 4-year CAGR of around 102%. This expansion is anchored in key states like Punjab, Haryana, and Tamil Nadu, where advanced milling techniques and organic certifications have significantly enhanced competitiveness. As a result, India has risen to the fourth rank among the top brown rice exporters globally in 2024, trailing Pakistan (US$ 377 million), the United States (US$ 218 million), and Uruguay (US$ 183 million), underscoring its growing influence in the international market. Supporting this growth, key players such as KRBL Limited, LT Foods Ltd., and Kohinoor Foods Limited are driving innovation with products like ready-to-cook brown rice and sustainable sourcing practices. Significant investments, including Riviana Foods’ US$ 27 million upgrade in 2019 for microwaveable products and recent expansions by LT Foods in 2023 to enhance organic processing capacity, have bolstered export capabilities. India’s exports now compete effectively with established players, supported by government incentives under the Agricultural and Processed Food Products Export Development Authority (APEDA). With domestic production exceeding 130 million tonnes annually, India is well-positioned to meet local demand while fueling exports. India’s export markets India’s brown rice exports are concentrated in high-growth Asian and African markets, capitalizing on proximity and affordability. Viet Nam leads as the dominant destination, accounting for a 74.0% share, driven by strong regional trade ties and demand for nutrient-rich staples. Nigeria follows with a 17.1% share, reflecting its reliance on affordable, health-focused imports amid food security challenges. Malaysia contributes 5.2%, while the Netherlands (1.9%) and Benin (0.7%) represent smaller but growing markets. The United States (0.3%) and other countries (0.8%) round out the export portfolio, highlighting India’s strategic focus on key emerging economies. The focus on Africa and Southeast Asia aligns with global shifts, where imports grew 12% year-over-year. The imposition of a 50% tariff by the U.S. on Indian goods poses challenges for India’s brown rice exports. Although the US represents a relatively small share of India’s exports compared to key markets such as Vietnam, Nigeria, and Malaysia, the tariff could affect competitiveness for premium varieties like basmati, potentially reducing demand by 10-15%, according to the Indian Rice Exporters Federation (IREF). With 74% of India’s brown rice exports directed to Vietnam, the country maintains a strong pricing advantage over competitors. Strategic diversification into non-tariffed markets in Asia and Africa should provides resilience, ensuring that overall export growth remains robust despite U.S. market disruptions. Untapped growth potential The brown rice sector holds immense untapped potential, with global demand projected to grow at 5-7% CAGR through 2035. In India, per-capita consumption remains low at under 5 kg annually far below global averages—offering room for domestic expansion via awareness campaigns and fortified products. Exports could double by
From waste to watts: Why bio-energy could spark the next energy revolution in India
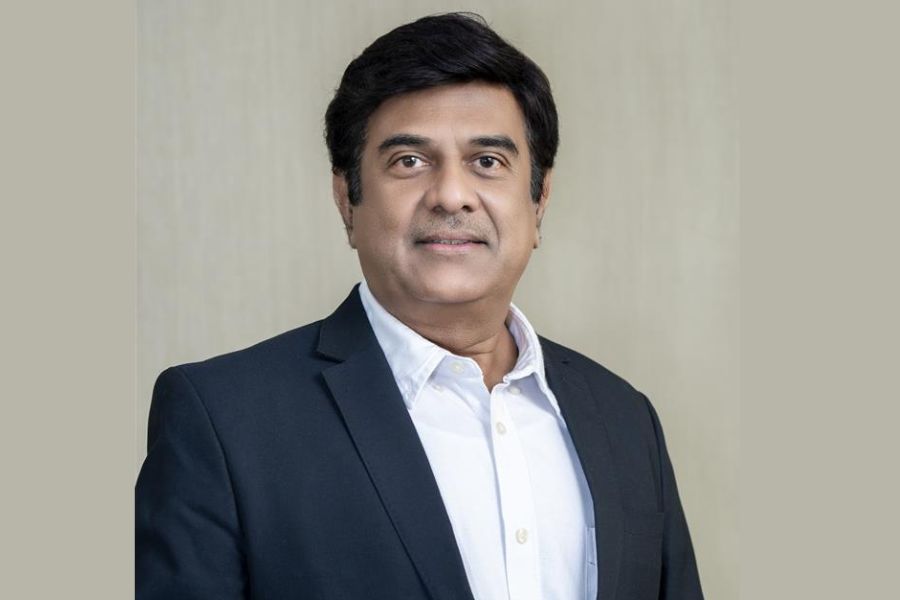
IBT recently interacted with Mr. Atul Mulay, President and Global SBU Head – Bio Energy at Praj Industries Limited, Pune. A Fulbright Scholar and seasoned leader, Mr. Mulay has played a pivotal role in shaping India’s biofuel ecosystem, including his contributions to the National Biofuel Policy 2018. He also serves as Chairperson of the National Bio-Energy Committee of the Trade Promotion Council of India (TPCI), alongside leadership roles at CII and IFGE. In this conversation, he shares his vision for bioenergy’s role in strengthening India’s energy sovereignty, the opportunities presented by emerging technologies like 2G ethanol, CBG, and SAF, and the policy and financing measures needed to scale the sector sustainably. He also reflects on India’s global positioning through the Biofuels Alliance and the inspiring pace at which the sector has evolved. IBT: The bioenergy sector in India has come a long way. What do you find most inspiring about its evolution so far? Atul Mulay: What inspires me most is the speed of transformation. Ethanol blending, once just an aspiration, has become a reality ahead of schedule. CBG plants are emerging across the country, and bioenergy has shifted from being seen as an alternative to being recognized as a mainstream contributor to India’s energy mix. Equally important, it has begun to impact the lives of farmers, rural communities, and industries, demonstrating that energy security can be achieved in tandem with “inclusive growth”. IBT: Looking ahead, what is your vision for how bioenergy in India can transform the energy landscape over the next decade? Atul Mulay: Over the next decade, I see bioenergy shaping India’s future in three defining ways. First, by strengthening our energy sovereignty—cutting crude oil imports and shielding the country from global price volatility. Second, by revitalizing rural economies, creating value-added markets for agri-residues and processing waste, and unlocking new income streams for farmers. And third, by positioning India as a global hub for bioenergy innovation and ecosystem development, setting a benchmark for the world. Bioenergy will not only complement solar, wind, and other renewables, but also serve as a cornerstone in anchoring India’s journey towards net zero. IBT: With India championing the Global Biofuels Alliance, how do you see the country positioning itself as a global hub for bio-energy innovation and trade? Atul Mulay: India has unique advantages — a significant agricultural base, proven industrial capacity, and strong government commitment. Through the Global Biofuels Alliance, while fulfilling India’s requirement of bioenergy, we will have the potential to export not just fuels but also low CI fuels, innovations, technologies, supply chain models, and policy frameworks to build a role model global ecosystem. This positions India as a hub for both innovation and trade, while deepening our diplomatic and economic engagement with both developed and emerging economies worldwide. IBT: Which policy measures do you believe could most effectively accelerate the adoption of bio-energy solutions across industries? Atul Mulay: I believe four policy levers can most effectively accelerate the adoption of bioenergy solutions across industries. First, a unified National Bio-Energy Policy with clear long-term targets that synchronizes the vision of both central and state governments. Second, stronger carbon credit mechanisms and climate finance frameworks that make bioenergy projects truly bankable. Third, mandatory adoption in hard-to-abate sectors—such as co-firing biomass in thermal power plants and introducing Sustainable Aviation Fuel as a drop-in option, along with higher blending mandates for conventional fuels. And finally, aligning policies with the automobile sector to ensure faster adoption by end consumers. Taken together, these measures would give the sector the predictability and confidence it needs to scale sustainably. IBT: How can bioenergy best complement solar, wind, and hydro in helping India achieve its net-zero goals? Atul Mulay: Solar, wind, and hydro are excellent sources of clean power, but they are intermittent. Bioenergy, by contrast, is storable and dispatchable. That makes it the perfect complement — providing firm, round-the-clock renewable energy. Beyond power, bioenergy also decarbonizes hard-to-abate sectors, such as aviation, shipping, and heavy industries, where solar or wind may not be a direct substitute for fossil fuels. IBT: Among emerging technologies like 2G ethanol, biogas, bio-CNG, and SAF, which do you see offering the most tremendous near-term potential for India? Atul Mulay: Each of these technologies—2G ethanol, compressed biogas (CBG), and Sustainable Aviation Fuel (SAF)—will play a pivotal role in India’s energy transition. 2G ethanol strengthens sustainability by converting agricultural residues into clean, low-carbon fuel. CBG taps into both urban and rural waste streams, creating powerful circular economy solutions. SAF is critical to decarbonizing aviation and positioning India as a competitive global supplier. Rather than one technology dominating, they offer complementary pathways for mobility and energy security. The real determinant of scale will be ecosystem readiness, supportive policy frameworks, and the bankability of projects. IBT: What strategies can ensure a reliable and sustainable supply of biomass/feedstock without compromising food security? Atul Mulay: The key lies in strengthening India’s supply chain and distribution framework. Three priorities stand out: building a timely biomass harvesting and aggregation ecosystem with fair and transparent pricing for farmers; promoting energy crops such as sweet sorghum, bamboo, and grasses on marginal lands; and developing efficient collection, densification, and logistics systems to lower costs. In the near term, India already has sufficient surplus and damaged grain to support ethanol production. At the same time, agricultural research institutes are advancing productivity gains, intercropping models, and AI-based solutions to expand feedstock availability. Key focus areas include sugarcane, corn, broken rice, and innovative intercropping practices such as sugarcane–corn and tapioca–corn across diverse regional terrains. Institutions such as the Indian Maize Research Institute, the Vasantdada Sugar Institute (VSI), and other leading research centers are driving this work. Their efforts are expected to yield visible results within the next 2–5 years, further strengthening India’s long-term bioenergy feedstock base. IBT: How can financing models and community engagement help scale bio-energy projects, particularly in rural and semi-urban areas? Atul Mulay: Innovative financing models, such as priority lending status, Viability Gap Funding, and climate finance, are vital to attracting investors.

Does sugar still rule in health-conscious India?
India’s sugar sector is experiencing contrasting trends. Institutional consumption has surged to 60–65% of total demand, driven by beverages, confectionery, and processed foods, with rural and mid-income consumers fueling growth. At the same time, household sugar use is diverging by income: affluent families are cutting back on refined sugar in favor of jaggery, khandsari, and low-sugar alternatives, while low- and mid-income groups are set to expand branded sugar adoption. The way Indians consume sugar is undergoing a shift, with industries such as beverages, bakery, and confectionery now accounting for a larger share. Over the past five years, institutional consumption has expanded from 50–55% to 60–65% of total sugar demand, as per a recent report covered by the Indian Sugar and Bioenergy Manufacturers Association (ISMA). Within institutional usage, non-alcoholic beverages take the lead with 35–40% share, followed by confectionery at 15–18%. Other notable contributors include dairy and ice cream, hotels, restaurants, cafeterias, pharmaceuticals, nutraceuticals, and food processing industries. The report points to mid-income urban consumers and rural households as key demand drivers. Interestingly, rural youth, in particular, view sugar-rich products such as soft drinks and confectionery as aspirational purchases, aligning them with urban consumption habits. This shift underscores how rising disposable incomes and exposure to branded goods are reshaping food choices beyond metropolitan markets. Household sugar trends: A complex mix While institutional demand is climbing, household sugar consumption is evolving along very different lines. The detailed analysis by ISMA shows how income levels are shaping sugar choices: Affluent households (around 30 million): Refined sugar usage is gradually declining. These consumers are moving towards healthier alternatives and traditional sweeteners such as jaggery (gur) and khandsari. They are also experimenting with low-sugar and functional food options, a trend expected to intensify by 2030. Mid-income households (about 70 million): These families remain heavily reliant on refined sugar, though they continue steady consumption of gur and khandsari. Slowly, they are beginning to adopt branded sugar and alternative sweeteners, with expectations of wider adoption by 2030. Lower-income households (205 million): Adoption of branded sugar remains limited, but cultural preferences for jaggery and khandsari hold strong. As purchasing power grows, branded sugar usage is projected to rise significantly in this segment. The report also highlights how India’s per capita sugar consumption has plateaued at around 20 kg annually, slightly below the global average of 22 kg. However, with population growth and rising incomes, overall consumption volumes are still expanding. On the production side, ISMA projects India’s sugar output could grow from 34 million tonnes to as high as 45 million tonnes by 2029–30 in an optimistic scenario. The domestic sugar market, currently valued at ₹1.2 trillion, is expected to expand to between ₹1.4–1.6 trillion in the base case and up to ₹2 trillion in the optimistic case by 2030. The dual narrative: Growth and health consciousness The report underline the duality of India’s sugar market. On one hand, institutional demand is accelerating, fueled by aspirational consumption, especially among rural and mid-income groups. On the other, affluent consumers are driving moderation, shifting towards healthier and alternative sweeteners. This divergence creates opportunities and challenges for FMCG companies. Brands catering to beverages, confectionery, and packaged foods will continue to find robust demand from younger and mid-income consumers. At the same time, the health-conscious shift among affluent households is pushing companies to innovate with low-sugar, natural, and functional alternatives. By 2030, the sugar landscape in India is likely to be even more segmented: Institutional consumption will remain the backbone of demand, supported by the rapid expansion of food and beverage industries. Household consumption will see a sharper divide, with affluent groups reducing refined sugar intake and low- to mid-income households increasing branded sugar adoption. Production and market value are expected to rise steadily, though growth will hinge on balancing affordability, health trends, and sustainable farming practices. Conclusion India’s sugar sector stands at a crossroads, balancing its deep-rooted cultural affinity for sweetness with the rise of health-conscious preferences. On one side, institutional demand continues to surge; on the other, household trends reveal shifting patterns across income groups with long-term implications. For industry stakeholders, policymakers, and FMCG brands, the challenge lies in serving a diverse consumer base—one that indulges in sugar-rich products while increasingly seeking healthier, traditional, and innovative alternatives. Read more From cane to clean: India’s ethanol push reshapes sugar trade FMCG prepares for challenges under lower GST Top Indian food trends 2025: From affordability to health FAQs 1. How much sugar does India consume per person?India’s per capita sugar consumption is around 20 kg annually, slightly lower than the global average of 22 kg. 2. Why is institutional sugar consumption increasing in India?Institutional sugar use has surged due to rising demand from beverages, confectionery, bakery, biscuits, dairy, and processed foods, especially among rural and mid-income consumers. 3. Which sectors consume the most sugar in India?Non-alcoholic beverages lead with 35–40% share of institutional sugar use, followed by confectionery at 15–18%, along with dairy, ice cream, hotels, restaurants, and food processing. 4. Are Indian households reducing sugar intake?Yes, affluent households are cutting back on refined sugar and shifting to jaggery, khandsari, and low-sugar alternatives. However, mid- and low-income groups are expanding their use of branded sugar. 5. Why are rural consumers increasing sugar consumption?Rural youth view sugar-rich products like soft drinks and confectionery as aspirational, leading to higher demand in line with urban consumption trends.